Curated OER
Graphing Calculator Activity
In this graphing calculator worksheet, students explore the steps to analyze a complex fraction using a graphing calculator. They simplify a complex fraction to a proper fraction. This four page worksheet contains detailed instructions...
Curated OER
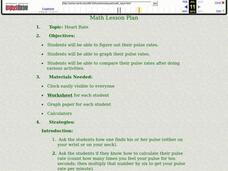
Graphing Heart Rates
Students take their pulse rates. In this graphing lesson, students take their pulse rates and graph them. Students do various physical activities and graph the differences in their pulse rates.
Curated OER
Transforming Snoopy Using Coordinates
Students graph coordinate points to create a picture of Snoopy. In this coordinate point lesson, students read a book and learn about Rene Descartes' invention, the coordinate grid. Students graph a surprise picture on...
Curated OER
Density Graph Questions
In this density worksheet, students use the mass of aluminum and copper at different volumes to create a graph in order to calculate the density of these metals. This worksheet has 1 graph, 2 short answer, and 5 word problems.
Curated OER
More Density Graph Questions
In this density graph learning exercise, students graph data displayed in a chart. Students also calculate the density of each metal shown in the graph. Students answer questions about which detail is more dense.
Curated OER
Graphing Linear Functions
In this linear functions worksheet, 9th graders solve and complete 30 different multiple choice problems that include graphing. First, they determine the expression that is equivalent to the given expression. Then, students determine the...
Curated OER
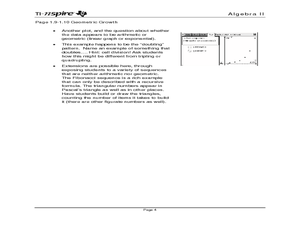
Sequence Graphs
Investigate arithmetic and geometric sequences by using a graphing calculator to determine if a sequence is linear or exponential.
Curated OER
Designing Models to Simulate Actual Events Using a Random Number Generator
Students design models to simulate actual events using a random number generator on a calculator. They estimate the likelihood of a particular outcome using results of simulations. Answer Key included.
Curated OER
Using a Spreadsheet to Understand Density
Students use density to identify what metal a gold colored weight is made of. They use a spreadsheet to graph the experimental density of common metals and compare the know densities to their calculated density of the known metal.
Curated OER
Solving Systems by Graphing
Solve systems of equations with your super smart upper graders. They solve systems of equations and then graph two lines to find where they intersect. The focus on the activity is to have learners explore moving a point to...
Curated OER
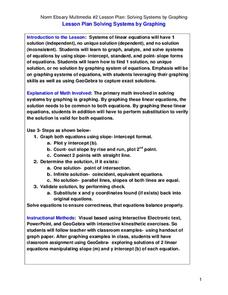
Solving Systems by Graphing
Students solve systems of equation through graphing. In this algebra lesson, students solve linear equations and analyze the result to figure out if there is one solution, no solution or infinitely many solutions. They graph their lines...
Curated OER
M&Ms; Line Plots and Graphing
Students, using small individual bags of M&Ms, engage in activities including; estimating, sorting, graphing, mean, median, mode, fractions, percentage, and averaging.
Curated OER
Graphing Systems at the Races
Learners investigate systems of equations as they use the Ti-Navigator to explore scenarios about dog races and NASCAR races. Pupils determine the winner of the race and when opponents pass each other given a speed and distance.
Curated OER
Data Collection and Graphing
Students collect data and graph it on a coordinate plane and analyze it. In this statistics instructional activity, students display their data collection using a graph. They determine which central tendency will work best.
Curated OER
Graph the Presidents At Inauguration- How Old Were They?
Students construct a graph of the presidents' ages at inauguration. In this U.S. history instructional activity, students use online resources to gather data about the presidents and accurately present their results on a graph.
Curated OER
Using Excel To Teach Probability And Graphing
Students engage in the use of technology to investigate the mathematical concepts of probability and graphing. They use the skills of predicting an outcome to come up with reasonable possibilities. Students also practice using a...
Curated OER
Graphing the Standard Curve
Students analyze colorimetric using a computer program. In this science lesson, students show application of standard curves by finding other areas of science where standard curve is analyzed.
Curated OER
The Demographics of Immigration: Using United States Census Data
High schoolers work together to analyze United States Census data on immigration. They compare and contrast the data and determine how immigration numbers have changed over time. They calculate percentages and make their own...
Curated OER
Determining the Density of a Drop of Water-A Graphing Exercise
Students determine the density of 1 drop of water. In this determining density lesson plan, students determine the mass and volume of a drop of water in the lab using appropriate lab techniques and calculate the density of a drop of water.
Curated OER
Classifying Triangles by the Length of the Sides Using Cabri Jr.
Learners follow detailed directions to create triangles on their graphing calculator. In this properties of triangles lesson plan, they will create triangles on their calculators using the Cabri Jr. application. They then identify three...
Curated OER
Making Informed Decisions Using Measures of Central Tendency
Students calculate the mean, median, mode, range, and interquartile range for a set of data. They create a box and whisker plot using paper and pencil and technology and determine which measure of central tendency is the most helpful in...
Curated OER
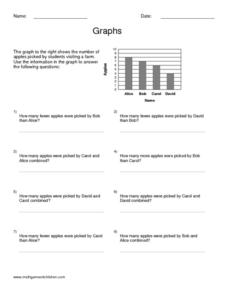
Graphs
In this algebra worksheet, students calculate the point of intersection between a circle and a straight line. There are 5 questions with an answer key.
Curated OER
Collect Data Using a Transect Line
Students learn about transect lines through a study of marine debris. In this marine debris activity, students calculate the items on a transect line and graph them. Students complete a category worksheet.
Texas Instruments
Graphing Calculator Investigation Graphs of Relations
Learners investigate relations in this algebra lesson. They graph the set of ordered pairs that determine a relation. Using a TI-83 Plus, your learners will enter the coordinates in a list, create a scatter plot, and manipulate the...


