Curated OER
Using Cabri Geometry to Create Fractals
Learners construct the Sierpinski Triangle using Cabri Jr. They use a step-by-step guide to construct the Sierpinski Triangle on their graphing calculator and then discuss the formula for constructing a nth stage Sierpinski Triangle.
Curated OER
Using Tables to Solve Linear Functions
Oh that intercept! Budding algebra masters solve linear equations from standard to intercept form. They identify the slope and y-intercept to help graph the lines, an then create coordinate pairs using a table of values. Great TI tips...
Curated OER
Calculate Rates Using Appropriate Units
In this Algebra I/Algebra II worksheet, students solve verbal problems in which they calculate the indicated rate and choose the appropriate unit of measurement. The three page worksheet contains a combination of nineteen multiple...
Curated OER
Solving Systems using Elimination
Using elimination to find the point of intersection of two lines, students learn to solve systems of equation. They graph their solutions and use the TI to verify the solution.
Curated OER
Using Color as Defense
Learners explore mimicry and crypsis, participate in hands-on predator-prey activity, and practice calculating averages and graph results in histogram.
Curated OER
Translate Word Phrases and Sentences into Equations
Use this video to show your learners an example of how to translate word phrases into an equation to solve a real-world problem. The presenter begins with a review of how to use cross products to solve a proportion, including how to do...
Curated OER
Worksheet 4: Limits
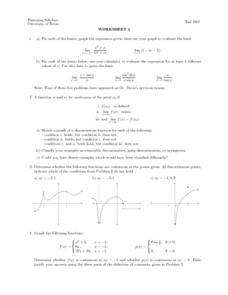
In this limits worksheet, students evaluate limits and graph given expressions. They classify graphs as removable discontinuities, jump discontinuities, or asymptotes. this two-page worksheet contains seven multi-step problems.
Curated OER
Fishing for Points
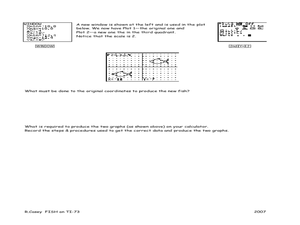
Learners explore the concept of ordered pairs. In this ordered pairs lesson, pupils list the ordered pairs of a graph in the shape of a fish. They use their calculator to translate the fish using lists, then translate the fish left,...
Alcohol Education Trust
Talk About Alcohol: How Much Alcohol is in a Drink?
Introduce your class to alcohol content. In order to become aware of the varying strengths of alcoholic drinks, class members complete a chart and plot a bar chart with the results. They make observations about the results.
Curated OER
Excel Lesson
Students explore data and Excel spreadsheets. They collect data about political candidates. Students enter the data into a chart on Excel. They create a graph using the data and Excel.
Curated OER
Ordering Rational Numbers and Finding Their Approximate
Middle schoolers explore the concept of ordering rational numbers on a number line. They represent rational numbers as decimals and percents. Pupils create a foldable about converting fractions to decimals to percents, and use a...
Curated OER
Curved Lines
In this curved lines worksheet, students examine equations that, when graphed, present a curved line. They explore specified points on the graphed line and write an equation for the tangent line at given points. This two-page worksheet...
Curated OER
Pictograph to Bar Graph
Second graders explore organizing data to make it useful for interpreting picture graphs and bar graphs. They use Graphers software to create a pictograph and a bar graph.
Curated OER
Spreadsheet Graphs
Students create graphs using information from spreadsheets. They select a topic from the following choices: website use, digital cameras, spreadsheets, calculators or educational software. They tally the class results and create an...
Radford University
Projectile Motion and Quadratic Functions
Model the flight of a ball. Small groups collect time data for how long it takes to toss a ball between two people. The teacher leads a discussion about projectile motion to get the class thinking about how to calculate the equation of...
Curated OER
Systems of Inequalities
In this graphing systems of inequalities worksheet, students solve and graph 4 inequalities with the help of a computer. Students solve 2 more systems of inequalities using the calculator.
Curated OER
Statistical Calculations Using M&Ms
In this frequency activity, students investigate, frequency, box plots, and percentage using a package of M&Ms. Copies of the actual correspondences with the Mars company are also included.
Curated OER
Follow That Graph
Students investigate the graphs of six trigonometric functions. They discover how changes in the equation of the basic function affect the graph of the function.
Curated OER
Calculating & Graphing Using a Spreadsheet
Students use the lab apparatus to calculate the average velocity and average acceleration at several points and record the data. They use the spreadsheets to plot distance vs. time, velocity vs. time and acceleration vs. time graphs.
Curated OER
Creating a Bar Graph Using a Spreadsheet: Dice Rolling Probabilities
Tenth graders explore the concept of spreadsheets. They create a simple spreadsheet and chart from given data. Students perform basic formatting procedures on their chart. They use spreadsheet functions to perform calculations.
Curated OER
Timed Multiplication Test Graphs
Students use the tools of data analysis for managing information. They solve problems by generating, collecting, organizing, displaying histograms on bar graphs, circle graphs, line graphs, pictographs and charts. Students determine...
Curated OER
Using Averages to Create Graphs Through Excel
Sixth graders create and use a spreadsheet to make graphs which will be used to analyze Progress Report and Final Report Card grades. They practice finding the mean, median, mode, and range of a data set. Students also incorporate column...
Curated OER
Graph Functions: Practice
In this graph functions instructional activity, students complete several activities to help them graph functions. Students use the table and the graph to complete the questions. Students also answer two test prep questions.
Curated OER
Reading a Graph: Azimuth Range vs. Day in Barrow Alaska
Students practice reading a graph while doing story problems. They determine the x and y intercepts and calculate the slope. They also practice writing linear equations.


