Curated OER
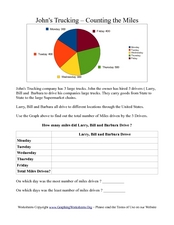
John's Trucking- Counting the Miles
In this graphs worksheet, students analyze a pie graph showing miles driven by three truck drivers in a week. Students fill out a chart in which they calculate total miles driven.
Curated OER
Math Handbook: Trigonometry
You'll be spinning in unit circles once you read through this jumbo-sized resource of everything you need to know about trigonometry. Each page has color-coded examples with explicit directions that detail the problems and...
Mathalicious
Domino Effect
Carryout the lesson to determine the cost of pizza toppings from a Domino's Pizza® website while creating a linear model. Learners look through real data—and even create their own pizza—to determine the cost of each topping. They...
Columbus City Schools
To Measure its Mass or Volume?
Atoms, elements, and molecules, oh my! Teaching the fundamentals of chemistry to curious sixth graders has never been easier to accomplish. Here is a resource that pulls together everything needed to get them off to a good start,...
Curated OER
Twelve Days of Christmas
Learners create charts and graphs using a spreadsheet. They chart the number of each gift given day by day from the song, "The Twelve Days of Christmas." They create a bar graph and a circle graph from their data on the spreadsheet.
Curated OER
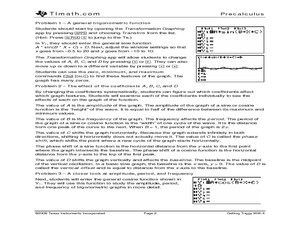
Getting Triggy With It
The concept of sine and cosine is explored in this lesson where students graph sine and cosine graphs using a transformation application on the graphing calculator. Students change the coefficients for the amplitude, period,...
Curated OER
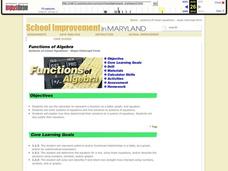
Systems of Linear Equations
Students use the calculator to represent a situation as a table, graph, and equation. They write systems of equations and find solutions to systems of equations. In addition, they explain and justify how they determined their
solutions...
Curated OER
Volume and Surface Area: Which Is More?
Learners explore the volume and surface area of three dimensional figures. Through the use of video, students discover three dimensional shapes, their uses in real-life applications, and methods used to calculate their volume and surface...
Michigan Sea Grant
Water Quantity
It may be tricky for a young mind to conceptualize that less than 1% of all water on earth is useable for humans to drink. Simulating the amount of fresh water available on earth by removing measured amounts of water from a five-gallon...
Curated OER
Cryptography on the TI-83 Graphing Calculator
Learners explore the history of cryptography. They assess function notation and transformation, matrix operations, and the fundamentals of modular arithmetic. Using graphing calculators, students develop their own encryption schemes.
Curated OER
Where Did We Go on Holiday This Year?
In this differentiated whole-group activity worksheet, students list all the places they visited over the summer, record the places on a flip chart, calculate the distances on a road map and graph the data they collect.
Curated OER
What's Your Line?
Fifth graders collect temperature readings over a period of time, enter the information into a spreadsheet and choose the appropriate graph to display the results.
Curated OER
Thanksgiving Dinner
Young scholars plan a traditional Thanksgiving dinner. In this Thanksgiving lesson, students compare and contrast the first Thanksgiving to Thanksgiving celebrations today. Young scholars plan a traditional Thanksgiving dinner and...
Curated OER
How High Are the Clouds?
Students analyze height and collect data to create a graph. For this statistics lesson, students use central tendencies to analyze their data and make predictions. They apply concept of statistics to other areas of academics to make a...
Curated OER
What Are We Listening To?
Learners gather data from a web site on number of music albums sold by genre for the last two years. They convert these figures to fractions, decimals, and percents, and display the results in bar graphs and pie charts.
Curated OER
Calculating Speed
Fourth graders complete an experiment on calculating speed. For this speed calculation lesson students complete an activity in which they have dominoes fall as slow as possible.
Curated OER
Transportation Math
Students explore the concept of exponents. In this exponents activity, students evaluate various bases to powers. The bases to a given power are in the context of miles driven, stops on a route, and minutes spent in...
Curated OER
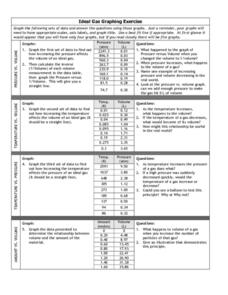
Graphing Exercise of Ideal Gas Data
In this graphing of Ideal Gas Data learning exercise, students use the given data to draw 4 graphs of the given data. They are given the pressure and volume to draw and interpret the graphs.
Curated OER
Graphing Linear Functions
Learners practice solving systems of linear equations using the substitution and elimination methods. They determine if the system has one, infinite or no solution. Students also graph the linear equations.
Curated OER
Graphing Absolute value Inequalities
High schoolers investigate the concept of inequalities and practice graphing them at various degrees of difficulty. They review the basic rules with the teacher at the level of theory which may make it harder for them to understand...
Virginia Department of Education
Transformationally Speaking
Young mathematicians explore transformations of graphs by graphing sets of functions on the same pair of axes. They use their graphs to determine the effect that the values of a and b in y = ax + b have on the graph of y = x.
Curated OER
Box Plots
Young statisticians are introduced to box plots and quartiles. They use an activity and discussion with supplemental exercises to help them explore how data can be graphically represented.
Curated OER
Maps and Modes, Finding a Mean Home on the Range
Fifth graders investigate data from maps to solve problems. In this data lesson, 5th graders study maps and collect data from each map. Students present their data in a variety of ways and calculate the mode, mean, median, and range.
Curated OER
Can You Count on Cans?
How can a canned food drive be connected to math? It's as simple as counting and organizing the cans! Children demonstrate their ability to sort non-perishable foods into categories that include soup cans, vegetable cans, boxed items,...


