Curated OER
Graphing With RXTE
Students use data from the Rossi X-ray Tiiming Explorer (RXTE) satellite to analyze and graph.
Curated OER
Data Collection Project
Young scholars collect data using email. They calculate the mean, median, mode, range and outliers. They create a graph using the data results. They write five paragraphs to summarize their data.
Curated OER
Calculate It
Fourth graders find the area and perimeters of squares and rectangles using a calculator to check their multiplication. They use the appropriate formulas to find the area and perimeter of the given geometric shapes.
Curated OER
Walking on Air
Students collect and analyze data with a graph. In this statistics lesson, students use central tendencies to find the meaning of their data. They display the data on a Ti calculator.
Curated OER
Means of Growth
Pupils collect and graph data. In this statistics lesson, students analyze their plotted data using a scatter plot. They identify lines as having positive, negative or no correlation.
Curated OER
Graph of the Tangent, cotangent, Secant, and Cosecant Functions
In this college level Pre-calculus worksheet, students examine the graphs of the Tangent, cotangent, secant, and cosecant functions. Students find the intercepts and any asymptotes. The seven page worksheet contains...
Curated OER
Graphing Data from the Chemistry Laboratory
Students graph and analyze data using a spreadsheet.
Curated OER
Polynomial Functions
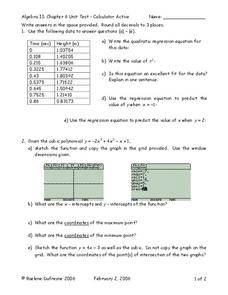
In this Algebra II worksheet, 11th graders use a graphing calculator to determine the regression equation of the given data, graph polynomial functions, factor polynomials, and determine the quotient and remainder in polynomial division....
Curated OER
Let's Go Slopey
Pupils create a table of values to graph a line. For this algebra lesson, students identify the slope and intercept of a linear equation. They use a Ticalculator to graph their function.
Curated OER
MOVING IN TWO DIMENSIONS (GRAPHING)
In this graphing worksheet, students are asked to graph a "sketch" of a path walked by a student. Directions E, W, N and S are used. Students are given 8 graphs to complete and are then asked to evaluate their findings.
Curated OER
Charting a New Course
Students calculate the distance they will travel. In this geometry lesson, students use the TI and CBL system to make calculation of a certain path. They explore geography by calculating distances between different areas as it relates to...
Curated OER
Supersonic Dream
Students explore how fuel use affects the mass of different planes during flight and graph their results. They determine the per person fuel cost of a transatlantic flight for seven airplanes
Curated OER
Slopes and Lines
Students identify the slopes of a line. In this algebra lesson, students calculate the slope and intercept of a line. They graph their lines using a TI calculator.
Curated OER
Know the System
Students identify the different systems of equations. In this algebra lesson, students solve systems of equations using graphing, elimination and substitution. They use the Ti to graph their systems.
Curated OER
More on Limits, Graph Sketching, and L'Hopital's Rule
For this limits worksheet, students compute the answers to thirteen limits problems. They answer one short answer question. Students follow listed steps to simplify two limits problems. Students answer three short answer questions about...
Curated OER
Does Music Cam the Savage Beast?
Learners collect, graph and analyze data. In this statistics lesson, students measure the heart beat of a person as they listen to music. They use the CBL and TI to create a graph, analyzing the outcome.
Curated OER
Square Roots, Number Classification, Ordering & Graphing
Ninth graders identify numbers as rational or irrational. Using calculators estimation, and factoring methods, 9th graders compute the square root of numbers. They graph numbers in sequential order and round numbers integers to the...
Curated OER
Quadratic Applications
In this quadratic applications worksheet, students complete graphs, charts, comparison charts, and more having to do with quadratic equations. Students complete 5 different activities.
Curated OER
Lahar Travel Time
Ninth graders analyze published geologic hazard maps of California and comprehend how to use the map's information to identify evidence of geologic events of the past and present and predict geologic changes in the future. They select...
Curated OER
Confidence Levels
Learners collect data and graph it. In this statistics lesson plan, students rate confidence levels by collecting data and analyzing it. They graph their findings on the Ti calculator.
Curated OER
Trigonometry Review
In this trigonometry worksheet, students solve trigonometric equations, prove trigonometric identities, and graph trigonometric functions. The four page worksheet contains sixteen questions. Answers are not...
Curated OER
Acid-Base Titration
Students determine the concentration of an unknown solution. This task assesses students' abilities to state hypothesis, develop procedures for investigation, plan for recording and organizing observations and data, collect data, create...
Curated OER
Introductory Algebra Chapter 3 Review
In this math worksheet, students find the solutions to the problems while interpreting the line, bar, and circle graphs. The examples are given to help in the context of each objective.
Curated OER
Range and Mode
Students interpret data from graphs. In this range and mode instructional activity, students review a tally chart, pictograph and bar graph. Students use these graphs to calculate the range and mode of each set of data.


