Virginia Department of Education
Factoring for Zeros
Relate factors to zeros and x-intercepts. Scholars first graph quadratics in both standard and factored forms to see that they are the same. They go on to use the graphs to see the relationship between factors and x-intercepts.
Noyce Foundation
Snail Pace
Slow and steady wins the race? In the assessment task, scholars calculate the rates at which different snails travel in order to find the fastest snail. Hopefully, your class will move much more quickly in finishing the task!
Curated OER
Organizing Data
In this data worksheet, students convert measurements to significant notation and determine the number of significant digits. This worksheet has 4 fill in the blank and 2 short answer questions.
Curated OER
What Can I Afford?
Students explore the concept of cell phone plans. In this cell phone plan lesson, students research the cost of cell phones. Students compare various cell phone plans and decide on which phone plan is best for them.
PBL Pathways
Potassium-Argon Dating
Find the age of a fictional sample of rocks using a genuine approach. A well-designed lesson asks young mathematicians to use exponential modeling to analyze half-life. As a project-based learning activity, scholars communicate...
Mathed Up!
Histograms
Class members explore how to read and use histograms by watching a video on creating and analyzing histograms. To finish, the class works on a set of questions that tests these skills.
MENSA Education & Research Foundation
Roller Coaster Mania!
Raise the energy level of your physical science class with this exciting hands-on activity. Applying their knowledge of kinetic and potential energy and Newton's laws of motion, young engineers use foam tubing and marbles to create...
Curated OER
Graphing Linear Equations
Students graph linear equations. In this algebra lesson, students investigate the price of tolls in different states and create a graph. They analyze their graph and draw conclusions.
Curated OER
C is for Cookie-A MEAN-ingful Graphing Activity
Third graders, in groups, dissect a variety of brands of chocolate chip cookies and calculate the mean for each brand. They create their own bar graphs, pictographs, and line graphs to represent information.
Curated OER
Finding Patterns and Graphing Functions
Pupils investigate patters for area and perimeter. In this Algebra I/Geometry lesson, students explore two different patterns as they write a formula for the nth term of each pattern. Pupils graph their results and determine if the...
Curated OER
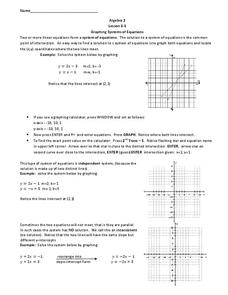
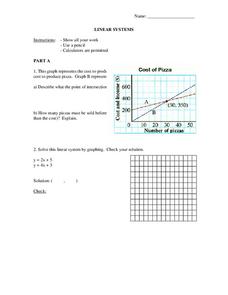
Graphing Systems of Equations
In this Algebra II learning exercise, 11th graders use graphing to determine the solution to a system of linear equations. The two page learning exercise contains explanation and three guided problems. Answers are not...
Curated OER
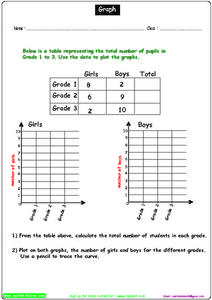
Graph Activity
In this graphing worksheet, students complete a data table, then use the data to draw a set of 2 graphs, calculate totals and plot numbers on both graphs.
Curated OER
Trigonometry Practice: Trigonometric Graphs #3
For this Trigonometry Practice worksheet, students are asked to graph a variety of trigonometric functions. A graphing calculator is required to complete these three pages.
Curated OER
Let's Graph It
In this let's graph it activity, student interactively answer 10 multiple choice questions about graphing data and types of graphs, then click to check their answers.
Curated OER
Graphing Your Motion
Seventh graders investigate velocity and speed. In this Vernier Probe lesson, 7th graders will use probes to calculate motion, speed, and velocity of an object. They will create a graph of their collected data.
Curated OER
Twenty-Eight Multiple Choice No Calculator Allowed AP Calculus BC Practice Exam
In this AP Calculus BC practice exam, students solve twenty-eight multiple choice problems without the use of a calculator. This worksheet should be completed in fifty-five minutes.
Curated OER
Graphing Trigonometric Functions
The student should be able to transfer his knowledge of graphing functions to graphing trigonometric functions. Student should be able to graph trigonometric functions, find amplitude, period, and frequency.
Curated OER
Using Inequalities to Problem Solve
Learners explore inequalities. For this Algebra I lesson, students solve and graph linear inequalities involving addition, subtraction, multiplication, or division. Learners use inequalities to solve and graph real-world problems.
Curated OER
Using a spreadsheet and the Internet to learn about stock market performance
Students record the progress weekly of a business of their choice on the stock market, graph those results, research and report on current news and how it pertains to the companies recent performance.
Curated OER
Graphing Linear Equations and Slopes
Students explore linear equations, parallel lines, perpendicular lines and slopes. Using computers with graphic calculators and word processing, students examine the relationship between the slopes of perpendicular lines and parallel...
Curated OER
Graphing Linear Equations
In this math worksheet, students practice solving systems of linear equations using the elimination and substitution methods. They also graph the solutions.
Curated OER
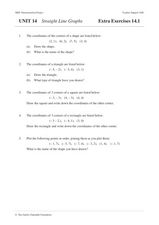
Straight Line Graphs
In this math worksheet, students plot lines on a graph paper when given the equation for the line in slope-intercept form. They tell the values of the slope and the y-intercept. Students find the x and y intercepts and plot three lines....
Curated OER
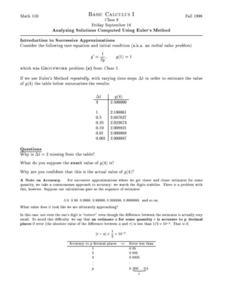
Analyzing Solutions Computed Using Euler's Method
In this analyzing solutions worksheet, students use Euler's Method to estimate the value of given functions. They estimate solutions using the piecewise-linear function model and sketch the information onto a graph. This two-page...
Curated OER
How are Trig Ratios Used to Measure Triangle Sides
Students identify the ratios of trig identities. In this geometry lesson, students solve the missing sides and angles of triangles using trig ratios. They relate the graphs and waves to real life scenarios.


