Curated OER
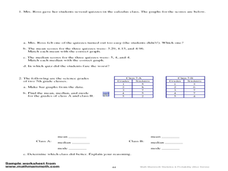
Using mean, median, and mode
In this mean, median, and mode activity, students read how to use each method and then complete problems using each one. Students complete 8 problems.
Curated OER
Seventeen Multiple Choice Calculator AP Calculus BC Practice Test
In this AP Calculus BC activity, students answer seventeen multiple choice questions with the use of a calculator. The questions are a fifty minutes times practice test for the AP exam.
Curated OER
Set Theory Review Using the TI Navigator
Learners use technology tools and resources for managing and communicating personal/professional information. They select and apply technology tools for research, information analysis, problem solving, and decision making in content...
Curated OER
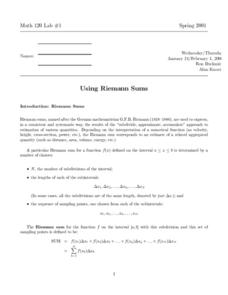
Using Riemann Sums
In the Riemann sums worksheet, students use Riemann sums to estimate the area under a curve. They calculate intervals and subintervals. Students create a graph picturing the intervals. This seven-page worksheet contains explanations...
Curated OER
Body Chemistry: Using the Periodic Table
In this periodic table worksheet, students use the data chart and the periodic table to solve questions about body chemistry.
Curated OER
Finding Area Using Geometry, Integrals, and Riemann Sums
In this area worksheet, students calculate area in five problems using geometry and integrals and find patterns using Riemann sums in one problem.
Curated OER
Statistical Analysis For Graphing Calculators
Students analyze date from the Chesapeake Bay. Using a graphing calculator, they enter the data, plot three temperatures, and create a Box and Whisker plot.
Curated OER
Using the Ti-83 Graphing Calculator
In this graphing calculator worksheet, students complete 11 operations on the calculator. Students enter absolute value, exponents, radicals, fractions, mixed numbers, etc.
Curated OER
Rational Function Graphs
Young scholars use algebraic methods to represent and solve problems. Using a graphing calculator, students solve rational and inequality problems. They visually demonstrate solutions of functions through graphing. Young scholars...
Curated OER
Graph Your Foot!
Students measure their own foot and place the outline on a graph. They make connections between the size of their foot and the bar graph that represents it.
Curated OER
Graphing Integers On a Coordinate Plane
Seventh graders explore the concept of graphing integers on a coordinate plane. In this graphing integers on a coordinate plane lesson, 7th graders discuss scenarios where coordinate systems are used in real life. Students represent...
Curated OER
Button Bonanza
Collections of data represented in stem and leaf plots are organized by young statisticians as they embark some math engaging activities.
Kenan Fellows
Weight and Balance of an Airplane
A career in aeronautics might be calling your class members. Building from the previous two lessons in the series, learners continue analyzing the mathematics of aeronautics. Groups create a paper airplane using paperclips for balance....
Teach Engineering
Applications of Linear Functions
It's not so straightforward — lines can model a variety of applications. Pupils experience linear relationships within the context of science, including Hooke's and Ohm's Laws. Class members got a taste of motion and speed from the...
Mathematics Assessment Project
Printing Tickets
That's the ticket! Pupils write and investigate two linear functions representing the cost of printing tickets. Individuals then determine which of two printing companies would be a better buy.
Concord Consortium
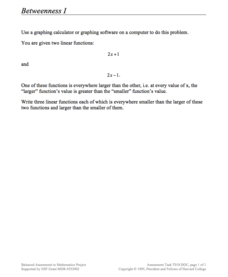
Betweenness I
Just between us, this is a pretty cool lesson! Given two functions with the same slope, learners write three new functions whose outputs are all between the given functions. The question is open-ended, allowing pupils to explore the...
California Education Partners
Animals of Rhomaar
Investigate the growth rates of alien animals. Pupils study fictional animals from another planet to determine how much they grow per year. The investigators plot the growth of their animals over a period of time and then compare...
Mathematics Assessment Project
Middle School Mathematics Test 5
A middle school test contains two 40-minute sections covering material through algebra. All questions involve applied problem solving or mathematical analysis.
Mathematics Assessment Project
Middle School Mathematics Test 1
A 13-page test contains two 40-minute sections, which provide word problems and applied analysis to cover material from pre-algebra through geometry.
Curated OER
Interest: Interest Olympics
Students determine how interests is calculated and a how it accrues. They examine charts and graphs that show the intricacies of interest. They determine how to increase their own saving by using interest while working with a partner to...
Curated OER
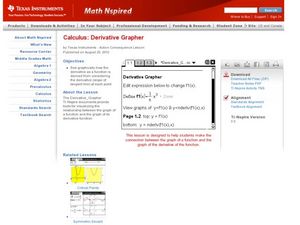
Derivative Grapher
Learners graph the derivative of functions in this calculus lesson. They use the TI to graph their functions and algebraically take the derivative of each function. They then create a visual and analyze the graph.
Curated OER
Who's got the fastest legs?
Students use a stopwatch to collect information for a scatterplot. In this fastest legs lessons, students collect data through the taking of measurements, create and find a median number. Students develop an equation and...
Curated OER
Oodles of Poodles
Students solve equations by graphing. In this algebra lesson, students differentiate between functions and relations. They use the TI to graph their equation and analyze the graph.
Curated OER
Student - Designed Density Experiment and Poster
In this student-designed experiment worksheet, students decide on an experimental problem to solve. Students use the scientific method to perform an experiment and record the data. Students calculate the density of liquid used in the...


