Curated OER
Instantaneous Rate of Change of a Function
Pupils draw the graph of a door opening and closing over time. They graph a given function on their calculators, create a table of values and interpret the results by telling if the door is opening or closing and evaluate the average...
Chicago Botanic Garden
Micro-GEEBITT Climate Activity
A truly hands-on and inquiry based learning activity bridges all the lessons in the series together. Beginning with a discussion on average global temperatures, young meteorologists use real-world data to analyze climate trends in order...
Curated OER
Ghostbusting in the Chesapeake
Ghost pots, fishing gear lost during crabbing expeditions, continue to trap crabs that are never collected. Increase your budding ecologists' awareness of human impact on the environment as well as conservation efforts using this...
Curated OER
What's Your Speed?
Learners explore the concept of distance v. time. They use a CBR to collect data on their distance over time, then plot their data using a scatter plot and find an equation to model their data. Pupils discuss what if scenarios which...
Curated OER
A Penny Saved is a Penny Earned
Students explore the concept of exponential growth. In this exponential growth lesson, students manipulate power models with base 2. Students discuss what would happen if you doubled a penny over the course of 20 days. ...
Curated OER
Chapter 15 Review, Section 2: Acid-Base Titration and pH
Keep it simple with this chemistry assignment. Learners examine an acid-base titration graph and answer four questions about the data. Then they will balance neutralization equations and calculate molarity for several specific solutions....
Curated OER
In A Heartbeat
Students discuss scatter plots then create a class scatter plot using their heart rate at rest and their heart rate after a few minutes of aerobic exercises. Students copy the points plotted as a class and create individual graphs...
Curated OER
Shedding Light on the Weather with Relative Humidity
Learners study weather using a graphing calculator in this lesson plan. They collect data for temperature and relative humidity for every hour over a day from the newspaper, then place the data in their handheld calculator and examine it...
Curated OER
Linear and Exponential Models
Students linearize data to determine if an exponential model is suitable. In this linearizing data to determine if an exponential model is suitable lesson plan, students graph the residuals of sets of data that appear to have an...
Curated OER
Complex Roots: A Graphical Solution
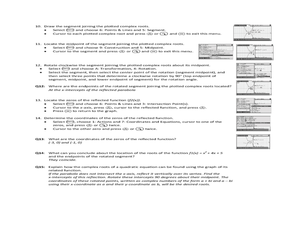
Using their Ti-Nspire to determine the solutions of parabolas, students explore the concept of complex roots. Students determine if parabolas have real or complex roots. Students determine the the axis of symmetry and the...
Curated OER
Corn-Crop is a Bin-Buster
Learners calculate percent change and create lists of data. They enter the corresponding bushels of corn measured in billions to their list and display, then convert the acres into scientific notation and use the value on the home screen...
Curated OER
Betweenness and the Sum of Parts
High schoolers differentiate lines and angles using betweenness in this geometry instructional activity. They differentiate angles and lines using Cabri Jr. and analyze the data and make conjecture.
Curated OER
Reflecting a Triangle in the Coordinate Plane
Learners explore geometric concepts using technology. They manipulate the TI to find important math topics. This activity requires a TI-84 or higher.
Curated OER
Is That Measurement Stuff For Real, Life?
Fifth and sixth graders engage in a series of activities which show them the importance of using different types of measurement strategies. One of the primary goals of the lesson is to show learners that measurement is helpful in many...
Curated OER
Exploring Quadratic Equations
By stretching and translating the parabola given and determining the effects on the equation, students explore finding the vertex and zeros of a parabola and relate them to the equation. Students also view the intercept form to determine...
Curated OER
Regents High School Examination PHYSICAL SETTING CHEMISTRY 2009
In this chemistry worksheet, students answer 50 multiple choice questions and 31 other questions that require them to solve, calculate and write short answers.
Curated OER
Access Ramp
Just about every public building that your students are familiar with has an access ramp which complies with ADA requirements. As it turns out, designing such a ramp is an excellent activity to incorporate slope, the Pythagorean Theorem,...
Curated OER
2008 U.S. National Chemistry Olympiad Part I
In this chemistry Olympiad worksheet, students solve sixty multiple choice questions on a variety of chemistry topics from finding molarity of solutions to calculating products of reactions. Students are given graphs, equations, reaction...
Curated OER
Baseball Statistics
Students take an in depth examine baseball record breakers. They calculate statistics, not just for one year, but over whole careers, to compare some famous players and find who was the best all-time home run hitter.
Curated OER
Roots of the Mariana Arc
Plumb the depths of the Submarine Ring of Fire and explore seismic waves with this lesson plan. Junior geologists simulate s-waves and p-waves, calculate their speeds, and then apply the data to discover the material that makes up inner...
Curated OER
Fall 2003 Midterm Exam #1
Electricity is the focus of this college-level midterm exam. It requres physics learners to answer multiple choice and short answer questions in addition to evaluating several diagrams and graphs. This is appropriate for most high school...
Curated OER
The Square Counting Shortcut
An excellent lesson plan that encourages students to discover how complex figures can be broken into simpler shapes when measuring area. Working with block letters, learners are given the freedom to develop their own strategies for...
Curated OER
Ranging the Triple M's
Fifth graders explore collecting and analyzing data. In this mean, median and mode lesson, 5th graders use real word data to determine the mean, median and mode. Students are given sets of numbers on index cards as asked to find the...
Curated OER
Charging Up, Charging Down
Learners collect and analyze voltage data. Then, they investigate exponential functions using the TI and a Voltage Probe and graph their data and analyze it using a table.


