Curated OER
Exploring Renewable Energy Through Graphs and Statistics
Ninth graders identify different sources of renewable and nonrenewable energy. For this math lesson, learners calculate their own carbon footprint based on the carbon dioxide they create daily. They use statistics to analyze data on...
SHS Algebra
Transformations of Linear and Exponential Graphs
Your transformers will create and analyze graphs to discover which operations produce which transformations. Linear and exponential functions are used to model the transformations.
Curated OER
Representing Numbers Using Scientific Notation
Learners explore the concept of scientific notation. In this scientific notation lesson, mathematicians discuss how multiplying by a power of 10 affects the decimal. They play Powers of 10 Yahtzee. Students roll a die five times and each...
Curated OER
Counting
First graders explore collecting data. They collect data using a data collection sheet and enter the data into Excel. Students create graphs using Excel. They share their graphs with the class.
Yummy Math
Playing with my calculator on the 4th of July
This fun activity guides learners through an exploration of the effects of replacing f(x) with -f(x), f(x) + c, k f(x), and f(x + c). Using graphing calculators, students experiment with variations of the graph of y = x^2 to design a...
Virginia Department of Education
Graphing Systems of Inequalities
Apply systems of inequalities to a real-world problem. Here, scholars learn to graph solutions to systems of linear inequalities. To finish the lesson, they solve a problem involving burgers and cheeseburgers using a system of inequalities.
Illustrative Mathematics
Graphs of Quadratic Functions
The equations look different, but their graphs are the same. How can that be? This activity leads your mathematicians in an exploration of three different forms of the same quadratic function. After comparing the equations, their graphs,...
Kenan Fellows
Man vs. Beast: Approximating Derivatives using Human and Animal Movement
What does dropping a ball look like as a graph? An engaging activity asks learners to record a video of dropping a ball and uploading the video to software for analysis. They compare the position of the ball to time and calculate the...
NASA
Geographical Influences
"If global warming is real, why is it so cold?" Distinguishing the difference between weather and climate is important when it comes to understanding our planet. In these activities, young scientists look at the climate patterns in a...
Annenberg Foundation
Skeeters Are Overrunning the World
Skeeters are used to model linear and exponential population growth in a wonderfully organized lesson plan including teachers' and students' notes, an assignment, graphs, tables, and equations. Filled with constant deep-reaching...
EngageNY
The Graph of the Natural Logarithm Function
If two is company and three's a crowd, then what's e? Scholars observe how changes in the base affect the graph of a logarithmic function. They then graph the natural logarithm function and learn that all logarithmic functions can be...
Flipped Math
Modeling with Quadratics
Do some interpretive modeling. Class members watch three examples of interpreting key features of a graph of a quadratic to find solutions to a real-world problem. Learners review how to find the key features on a graph using technology...
Flipped Math
Unit 2 Review: Polynomial Functions
Wrap it all up in a box. Pupils review the key concepts from an Algebra 2 polynomial functions unit by working 19 problems. Problems range from using the Remainder Theorem to find remainders and finding factors; sketching graphs by...
Curated OER
Now That's Using Your Head!
Explore linear measurement. Scholars will measure the circumference of their head and the distance they can jump. Information is recorded, averages are calculated, and a data table is completed. They then determine possible relationships...
Flipped Math
Calculus AB/BC - Estimating Derivatives of a Function at a Point
It seems like it should be about three. Pupils learn to get an estimate of the derivative of a function at a point by using the derivative functionality of their graphing calculators. They take that information to determine the equation...
Curated OER
Agriculture and the Government
Students study the government's involvement in the U.S. A's food production and make connections relating to farm programs. In this historical agriculture lesson, students read content and research significant information. Students then...
Curated OER
Intercepting Villans Using the Correct Rate
A Cyberchase video introduces the distance = rate x time equation. Participants then calculate answers to proposed problems and graph a series of results that is then incorporated into a game to help cement the concept. A thorough and...
Curated OER
Learning About A Graphing Calculator
Students investigate the use of a graphing calculator in solving problems. In this algebra lesson, students solve polynomials problems using a calculator.
Curated OER
Exploring Graphs of Inequalities
Learn how to solve inequalities and graph their answers. High schoolers use addition, subtraction, multiplication and division to solve problems. They analyze their graph using the TI calculator.
Pingry School
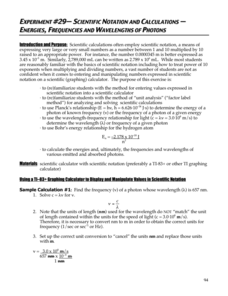
Scientific Notation and Calculations – Energies, Frequencies, and Wavelengths of Photons
The calculator has an interesting way of displaying numbers in scientific notation, but don't let that confuse your pupils! A lesson designed to give learners practice with scientific notation and calculators provides several practice...
Curated OER
Math Can Be Electrifying
Learners explore how math can be used to calculate and analyze how electricity causes air pollution. Students design a campaign to educate family members on ways they can save electricity. They create a graph that compares two electric...
EngageNY
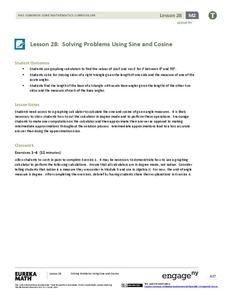
Solving Problems Using Sine and Cosine
Concepts are only valuable if they are applicable. An informative resource uses concepts developed in lessons 26 and 27 in a 36-part series. Scholars write equations and solve for missing side lengths for given right triangles. When...
Polar Trec
How Much Data is Enough?
The next time you read a magazine or watch the news, make note of how many graphs you see because they are everywhere! Here, scholars collect, enter, and graph data using computers. The graphs are then analyzed to aid in discussion of...
EngageNY
Translating Graphs of Functions
If you know one, you know them all! Parent functions all handle translations the same. This lesson examines the quadratic, absolute value, and square root functions. Pupils discover the similarities in the behavior of the graphs when...


