Teach Engineering
Air Pollution in the Pacific Northwest
Scholars investigate levels of nitrogen dioxide in the Pacific Northwest by examining the role of nitrogen in air pollution and how remote sensing can be used to measure nitrogen levels. An Excel spreadsheet calculates the difference...
National Security Agency
Partying with Proportions and Percents
Examine ratios and proportions in several real-world scenarios. Children will calculate unit rates, work with proportions and percentages as they plan a party, purchase produce, and take a tally. This lesson plan recommends five...
Cornell University
Math Is Malleable?
Learn about polymers while playing with shrinky dinks. Young scholars create a shrinky dink design, bake it, and then record the area, volume, and thickness over time. They model the data using a graph and highlight the key features of...
Curated OER
Residential Power System
Perform data analysis on energy consumption to apply algebraic expressions to the real world. Learners will write and solve equations that answer various questions from residential power use. They will collect data at home and calculate...
PBL Pathways
College Costs
Predict the year that college costs will double in your state using linear modeling. The first part of this two-part project based learning activity asks young mathematicians to use data from the College Board. They graph the data,...
Virginia Department of Education
Quadratic Equations
Review the multiple methods of solving quadratic equations through an analysis of the discriminant. Scholars use the discriminant to determine the best solution method and then solve various equations. As a challenge, learners build...
Curated OER
TE Activity: A Tornado in My State?
Students study data about tornadoes in the United States while completing a worksheet. They develop a bar graph showing the number of tornadoes for the top ten states in the US. They find the median and mode of the data set.
Curated OER
Linear Inequalities
Through exploration of linear programming through graphs and equations of inequalities, students relate linear programming to real life scenarios, such as business. Graphing and shading is also part of this exercise.
Curated OER
Watch Your P's and Q's
Using your graphing calculator, find all the rational zeroes of a polynomials by using the Rational Zero Theorem. Divide polynomials using the Remainder Theorem and the Factor Theorem and then graph it to find the number of real roots.
Curated OER
Proof of Identity
Students explore trigonometric identities. In this Algebra II lesson, students use graphing to verify the reciprocal identities. Using Cabri Jr, students investigate the Pythagorean trigonometric identities and the...
Curated OER
Metrically Me!
Students define the parts of a database, search strategies to locate information electronically, create/modify databases, etc. and enter data into a prepared spreadsheet to perform calculations.
Curated OER
Adding and Subtracting Integers: The Symbols + and -
This activity begins with an explanation of how to add and subtract positive and negative integers. Learners solve and complete 20 different problems that include these types of problems. First, they fill in each blank with the correct...
National Research Center for Career and Technical Education
Business Management and Administration: Compound Interest - A Millionaire's Best Friend
Many math concepts are covered through this resource: percentages, decimals, ratios, exponential functions, graphing, rounding, order of operations, estimation, and solving equations. Colorful worksheets and a link to a Google search for...
Curated OER
Linear Functions
Your learners will explore linear functions by analyzing a graph of the linear equations.Then learners analyze through calculating f(x+P) and g(x+p)
Curated OER
Slope-Intercept Form of a Line
Using the subscriber website Explorelearning.com, young mathematicians observe changes in the slope and y-intercept and their effect on the graph of lines. This activity helps students develop an intuitive sense of the connection between...
Curated OER
Finding Ocean Depth
How to oceanographers measure the sea's depth? Your scientists will step into their shoes in this application worksheet, first reading about how the speed of sound and a simple formula give scientists a depth estimation. Students...
Curated OER
Skate Party
Learners use the Frayer model during problem solving. In this problem solving instructional activity, they examine multiple methods of data collection to solve real world problems. Resources are provided.
Curated OER
Displacement vs. Distance Worksheet
Displacement is a foundational concept for physics pupils. If they are having trouble discerning it from distance, this activity can help clear things up. The first page is essentially a piece of graph paper. It has a compass rose and a...
Virginia Department of Education
Organizing Topic: Probability
The probability is high learning will occur! A well-designed unit introduces learners to the concepts of independent, dependent, and mutually exclusive events. Using Venn diagrams, the lessons ask learners to analyze many different...
Curated OER
Acceleration Lab
Young Einsteins experiment with the acceleration of Hot Wheels™ toy cars down inclined planes at various angles. This classic physics lab activity is thoroughly explained in both a teacher’s guide and a student lab sheet. Science...
Curated OER
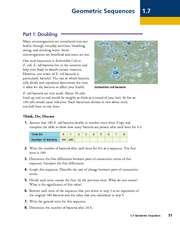
Geometric Sequences - Bacterial Growth
Bring algebra to life with scientific applications. Math minded individuals calculate and graph the time it takes a bacterium to double. They discuss geometric sequences and use a chart to graph their findings. There are 38...
Teach Engineering
A Shot Under Pressure
You've got to pump it up! Using the equations for projectile motion and Bernoulli's Principle, class members calculate the water pressure in a water gun. The pupils collect data on the number of pumps and distance traveled in order...
Inside Mathematics
Hopewell Geometry
The Hopewell people of the central Ohio Valley used right triangles in the construction of earthworks. Pupils use the Pythagorean Theorem to determine missing dimensions of right triangles used by the Hopewell people. The assessment task...
Inside Mathematics
Rhombuses
Just what does it take to show two rhombuses are similar? The assessment task asks pupils to develop an argument to show that given quadrilaterals are rhombuses. Class members also use their knowledge of similar triangles to show two...


