Curated OER
Census Statistics and Graphing
Students graphically represent data from the Census. In this middle school mathematics lesson, students investigate the housing characteristics of different tribes of Native Americans and compare them to the average American...
Curated OER
Classroom Census
Students identify the processes involved in data collection. They decide how census data can be used. Students engage in the data collection process and represent and interpret classroom data. They use scattergrams, arrow diagrams, block...
Curated OER
US Airports, Assessment Variation
Determining relationships is all part of algebra and functions. Your mathematicians will decide the type of relationship between airports and population and translate what the slope and y-intercept represent. The problem is multiple...
Curated OER
Ohio Census 1990 & 2000
Students use Ohio census data to solve problems, make comparisons, draw conclusions, and support predictions related to Ohio's population. They interpret and work with pictures, numbers and symbolic information.
Anti-Defamation League
The Gender Wage Gap
"Equal pay for equal work!" may sound logical but it is not the reality. High schoolers begin a study of the gender wage gap with an activity that asks them to position themselves along a line that indicates whether they strongly agree...
Curated OER
Analysing 2001 Census Microdata
Eighth graders examine the census data of 2001. In this American History lesson, 8th graders analyze data using one- and two-variable statistical analysis. Students develop a research question that makes use of the microdata.
Curated OER
Cities
Students examine U.S. Census figures. In this urban centers lesson plan, students compare city populations across the span of 50 years. Students create line graphs based on the data.
Curated OER
Graphically Speaking
Students discover the links between population and Congressional representation. In this government lesson, students research population statistics and create spreadsheets that compare population to the number of Congress members per state.
Curated OER
My Favorite Birthday
Learners collect and organize data from classmates, display data on simple chart, and plan class birthday party.
Curated OER
Canada Recycles! Do You?: Grades 4-6
In this recycling education instructional activity, students read a table regarding Canadian recycling statistics and respond to 9 questions regarding the data.
Curated OER
Problem Solving: Break a Problem into Parts
Learners work with the strategy of breaking a problem into parts in order to solve it. They write an expression with parentheses for each of the first three problems, and solve the problem, and use information from a table to answer the...
Curated OER
The Immigrant Experience
Students utilize oral histories to discover, analyze, and interpret immigration and migration in the history of the United States. A goal of the unit is fostering a discussion and encouraging students to make meaning of the bigger...
Curated OER
Celebrating Our Nation's Diversity
Second graders conduct a class census to measure diversity.
Curated OER
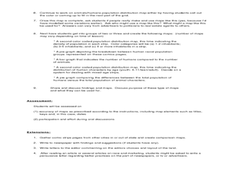
What is the Population Distribution of Cartoon Characters Living On the Pages of Your Newspaper?
Students read various cartoons in their local newspaper and calculate the population demographics, spatial distribution and grouping of the characters. Using this information, they create a population distribution map and share them with...
Curated OER
The Immigrants of Brooklyn: Now And Then
Students compare the immigrant population during the pre-Civil War era (1855) to that of today (2000 census data). They interpret circle and bar graphs comparing immigrant populations in Brooklyn yesterday and today, and create a class...
Curated OER
Making Sense of the Census
In this unit of lessons, students make sense of the census. They examine why a census is taken and participate in activities.
Curated OER
Modeling Population Growth
Learners investigate the reasons for taking a census and determine the problems that are involved in the process. They examine the population figure for Montana and Lake county before using the information to complete the included...
Curated OER
Making Sense of the Census
In this unit of lessons, students make sense of the Census. They examine why a census is taken and participate in activities.
Curated OER
Housing Arrangements of the Elderly in Canada
Students examine housing for the elderly in Canada. In this sociology lesson, students analyze Canadian Census data to find out what type of housing seniors of the country live in.
Curated OER
Slavery: Population Growth in Arkansas
Eighth graders examine the number of slaves in Arkansas in each census period from 1820 to 1860. They graph the data using the proper labeling and write a paragraph summarizing the data from each period making comparisons between slave...
Curated OER
The First Nations, Métis, and Inuit Peoples of Canada
Learners explore demographic shifts. In this Canadian Census lesson, students interpret data from the 2006 Census to determine the needs of the Aboriginal population in the country.
Curated OER
Pop Clock
Pupils review the Census Bureau's Homepage, gather information regarding population trends in order to make predictions on future populations.
Curated OER
Monster Graph Activity
Seventh graders engage in a instructional activity which take the fear out of graphing. They create and draw conclusions from data found in a Monster graph.
Curated OER
Education for Global Peace
Students survey the class and graph the results. In this graphing and data collection lesson, students conduct a survey to see where their shirts were produced. Individuals use software to graph the results and create a written...


