Curated OER
Sun or Shade?
Third graders use a thermometer to measure the air temperature in several places around the school and then graph the data. They grow 3 plants in different sunlight and record the growth.
Curated OER
Plot! Analyze! Draw your Conclusions!
Students download data reported from the Global Sun Temperature Project website. They graph and analyze the data looking for trends and patterns. They prepare a class report with their observations and post it to the website.
Curated OER
Learning Lesson: Ups and Downs
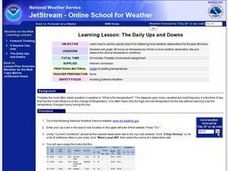
Students use the internet to find the air temperatures in their area. They create a graph based on the data. They analyze the data and examine tips for avoiding extreme weather.
Curated OER
Design Weather Instruments using LEGO Sensors
Students design and create a LEGO structure that will house and protect a temperature sensor. They leave the structure in a safe spot and check the temperature regularly and chart it. After the students have built their structures, the...
Curated OER
What is a Cloud
Third graders study clouds and how they are formed. They write acrostic poems about clouds and analyze and graph temperature data collected during varying degrees of cloud cover.
Curated OER
Trends of Snow Cover and Temperature in Alaska
Students compare NASA satellite data observations with student surface measurements of snow cover and temperature. They practice data collection, data correlations, and making scientific predictions.
Curated OER
Sunspot Activity
In this space science worksheet, students find the data that is needed to help them acquire the knowledge concerning sunspots through observation and data collection.
Curated OER
Ground Level Ozone
Students analyze real-time data and predict the level of ground ozone in their home city. They measure the level of ground ozone, submit their data to an online collaborative project, and create a web page presenting the dangers of...
Curated OER
Dimming the Sun
Students collect, interpret and analyze weather variable data. They describe atmospheric variables that affect evaporation. Students create graphs and analyze the information collected.
Curated OER
Class Final Report - Global Sun Temperature Project
Students reflect on the data they have analyzed during the Global Sun Temperature Project. They use the project website as a resource for their observations, draft a class report and post it on the Internet.
Curated OER
Analysis of Atmospheric Conditions for a High Mountain Retreat
Students examine the relationship between altitude, atmospheric pressure, temperature and humidity at a particular location. They practice science and math in real world applications. They write reports detailing their scientific...
Curated OER
Keep Your Eye on the Sky
Students examine the different types of satellites, cloud formations and weather patterns. In this weather lesson students use the Internet to research weather satellites, then write an article and create graphs.
Curated OER
Investigating Median, Mode, and Mean
Students develop strategies to organize data while following teacher demonstration. They calculate the mean, median and mode of a data set while determining the relationships between the numbers. They analyze data from tables and double...
Curated OER
Tracking the Salt Front
Using the Hudson River as the focus, learners discuss the difference between salt water and fresh water environments, analyze maps and graphs, and complete addition and subtraction problems. This activity comes with a wealth of...
Curated OER
Holey Clamshells
Students analyze data to make hypotheses and conclusions regarding the predator/prey relationship between moon snail and surf clams.
Curated OER
Keep It Cool
Pupils complete a science experiment to study insulation, heat transfer, and permafrost. In this permafrost study lesson, students design and test a soda insulator. Pupils graph their class data and discuss the results. Students discuss...
Curated OER
Trouble in the Troposphere
Students Use data sets from MY NASA DATA to produce graphs comparing monthly and yearly ozone averages of several U.S. cities. They analyze and evaluate the data and predict trends based on the data. In addition, they discuss and...
Curated OER
Tides
Students graph 40 days of high and low tide data for a site in Baja, Mexico near the Wetlands & Fisheries Live! research center. They identify patterns in the data and finally to make a connection between tidal heights and the phase...
Curated OER
Blowin' In The Wind
Students predict and hypothesize the reasons for wind movement. After viewing a video, they describe the effects of a high and low pressure system and what makes the wind blow. In groups, they construct instruments that measure air...
Curated OER
Trouble in the Troposphere
Students create graphs using NASA data, compare ozone levels of several U.S. cities, analyze and evaluate the data and predict trends based on the data, and discuss and describe how human activities have modified Earth's air quality.
Curated OER
Probability: The Study of Chance
Students practice the basic principles of probability by conducting an experiment, determining if a game is fair, collecting data, interpreting data, displaying data, conducting analysis, and stating and applying the rule for probability.
Curated OER
Observing Fall Migrants
Pupils observe the migration of monarch butterflies. They collect data regarding the number of monarchs they see, the location, the butterflies' behavior, the temperature and the date and time. Then they send their data to a university...
Curated OER
CSI Clamshell Investigation
Pupils explore and explain how moon snails eat and where the holes in clamshells come from and then draw conclusion from the data collected. They incorporate math and graphing skills to determine if there is a relationship to a clam's...
Curated OER
Lake Ice Out Lessons
Students explore the greenhouse effect. In this environment lesson, students describe how "ice out" affects animals and plants who live in a Maine lake. Students graph "ice out" data and make predictions about the upcoming weather.


