Curated OER
Mystery Paint
Students use the scientific method to determine the properties of various kinds of paints, use collected data to identify paint samples that are not properly labeled and use proper science safety techniques while working with chemical...
Curated OER
Let's Take a Chance!
Students investigate probability and the chance of an even happening. In this algebra lesson, students incorporate their knowledge of probability to solve problems and relate it to the real world. They learn to make decisions based on data.
Virginia Department of Education
A-Mazing Plants
Have your young scientists questioned why plants grow a particular way? Through this learning opportunity, scientists gain firsthand knowledge about how plants develop and various factors that affect rates of growth as they bring plants...
Curated OER
Tech Algebra: A Statistics Study
Students use the internet to gather a minimum of thirty pieces of data. Students create box and whisker graphs, and stem and leaf plots from the information. They calculate mean, median, mode, and range. Students write a summary and...
Curated OER
Where's the Beach?
Students use beach profile data to analyze how erosion and sediment transport changed seashore slopes. In this geology activity, students plot the data provided and analyze erosion patterns. They also assess coastal erosion management...
Curated OER
Tracking Temperature
Young scholars investigate the concept of temperature and how it has the tendency to fluctuate. They record the temperature as a class on a daily basis for a long period of time. The data is charted and then at a designated time students...
Curated OER
Clouds
Students explore basic cloud types and the weather associated with each one. In this earth science lesson, students participate in numerous activities including going outside to observe the clouds they see, making a cloud in a...
Curated OER
Predicting Temperature: An Internet/Excel Learning Experience
Third graders use the Internet (www.weather.com) to find the high temperature for our locale and the high temperature for another city around the world. They keep track of the temperature in these two locations for 10 days.
Curated OER
Surface Meteorological Observation System (SMOS)
Students investigate local surface weather conditions. They log weather conditions for thirty days, develop a graph, plot cloud cover, and compare/contrast the graphed lines of various weather factors.
Curated OER
Using Non-Text Features
Second graders examine graphs and charts from their local newspaper. As a class, they discuss what the data means and how it relates to the article. In groups, they are shown two sets of graphs or charts and they practice explaining...
Curated OER
Structure of the Earth
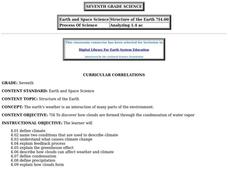
Seventh graders study the cause of climate change, and how clouds form and affect weather. They define condensation and precipitation, the greenhouse effect and the water cycle.
Curated OER
What is Climate?
Students explore the differences between climate and weather. For this introductory lesson of a climate unit, students discuss the vocabulary and concepts associated with weather and climate. They build their information base for the...
Curated OER
Paper Airplanes
Students study paper airplanes. In this lesson on aerodynamics, students print out the folding directions for making paper airplanes and after making the planes test their paper airplanes to see how well each flies. Students weigh...
Curated OER
Bar Me In
Fourth graders watch a video about constructing bar graphs. They create their own graph and interpret it.
Curated OER
Weather Variables Lab
Pupils examine what happens when air temperature drops and gets closer to the dewpoint. They perform a lab activity which illustrates the effects on humidity, precipitation and barometric air pressure.
Curated OER
Weather for Health
Ninth graders encounter various types of numerical information (represented in multiple ways), much of which is abstract and difficult to comprehend. In this instructional activity, 9th graders will convert given information into bar...
Curated OER
Cruise Conditions Graphing & Statistics
Students monitor weather conditions for an eighteen day period at a specific location. The temperature of both air and water is taken and the mean, median, and mode calculated. Differences between the highest and lowest recordings are made.
Curated OER
What's up with the weather?
Students use the weather as a context for collecting data and making interpretations based upon the observations. The scientific method is also taught to give them a way to conduct the data collection.
Curated OER
Precipitation in Michigan Cities
Third graders investigate the rainfall amounts in four Michigan cities to observe how cities near lakes are affected differently by precipitation than those that are inland. They record the rainfall for the cities over an eight day...
Curated OER
Sunrise-Sunset
Students gather data, make and share predictions about the time of sunrise ans sunset in their area. Patterns are analyzed and shared with students from other areas.
Curated OER
Worm Weather Predicted
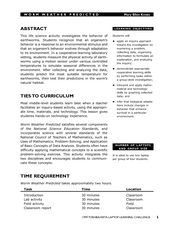
Students examine worm habitats. In this animal habitats lesson, students participate in a lab activity that requires them to explore the adaptations that earthworms make to their environment.
Curated OER
Strawberry Girl: Life on the Frontier
Students explore geographic changes by researching the state of Florida. In this Florida history lesson, students identify the storms and disasters that have created sinkholes in portions of Florida. Students read the book Strawberry...
Curated OER
Teaching about Diel Temperature Variation
Students explore temperature variation in lakes and deal with the data.
Curated OER
Chemical Weathering
Students measure the effect of water temperature on the rate of a chemical reaction, similar to the interaction of a weak acid and carbonate rock, using hot water and effervescent antacid tablets.


