Curated OER
Beautiful Bovine
Students compare and contrast a human body to a cow. Using a diagram, they label and identify the functions of the cow's numerous parts. In groups, they create a Venn Diagram to compare the various types of cows with one another. They...
Curated OER
Understanding Cloud Formation
Students explore air and clouds by watching demonstration. They perform an experiment to measure air pressure changes.
Curated OER
Science: Hurricanes As Heat Engines
Pupils conduct Internet research to track the path of Hurricane Rita. They record the sea surface temperature of the Gulf of Mexico during and after the hurricane and draw conclusions about how hurricanes extract heat energy from the...
Curated OER
Introduction to WorldWatcher: Coloring Temperature Maps
Students are introduced to the software program WorldWatcher. In groups, they discover the temperature variations throughout the world and color a map according to the temperatures. They also practice using visualization to communicate...
Curated OER
Twisters
Students differentiate between the terms 'tornado watch' and 'tornado warning' and simulate the conditions that produce tornadoes. They read "Night of the Twisters" by Ivy Ruckman and conduct an experiment using two-liter plastic...
Curated OER
Planet Research
Students recognize that the other eight known planets, which revolve around the Sun, have characteristics and surface conditions that are different from Earth; and identify examples of those differences.
Curated OER
Making Sense of Journey North Maps
Students use maps and answer core curriculum questions in order to increase comprehension and practice higher order thinking skills. This helps them develop writing skills through the practice of keeping Science Journals.
Curated OER
Careers in Science
Stuents explore the current job market for scientists. They explore types of jobs, salary range and job requirements. Students write a letter of application for a particular job.
Curated OER
Seasons' Journey : Putting it All Together
Third graders complete a diagram of the revolution of the earth around the sun and write a one paragraph explanation of the factors that cause seasons.
Curated OER
Cloud Shadows
Students classify clouds as transparent, translucent or opaque. They conduct an experiment to determine the visual opacity of several classroom objects and then conduct further observations of clouds.
NASA
Nasa: Precipitation Towers: Modeling Weather Data
This lesson uses stacking cubes as a way to graph precipitation data, comparing the precipitation averages and seasonal patterns for several locations. Variations on the lesson can accommodate various ages and ability levels. Students...
Other
Honolulu Hi 5: Cool Maps With Awesome Weather Data Across 1,219 Us Cities
Explore the weather in states and cities across the United States. Two maps with accompanying graphs are provided. The first indicates the number of comfortably warm summer days a place has and the second shows the temperature and how...
NASA
Nasa: Using Radiosonde Data From a Weather Balloon Launch
This lesson plan allows students to learn about the layers of the atmosphere and to learn how to graph real atmospheric data.
Center for Innovation in Engineering and Science Education, Stevens Institute of Technology
Ciese Real Time Data Projects: Weather Scope: A Study of Weather and Climate
Use real-time data to study factors that affect weather and climate, create weather instruments, and share data with learners around the world.
Illustrative Mathematics
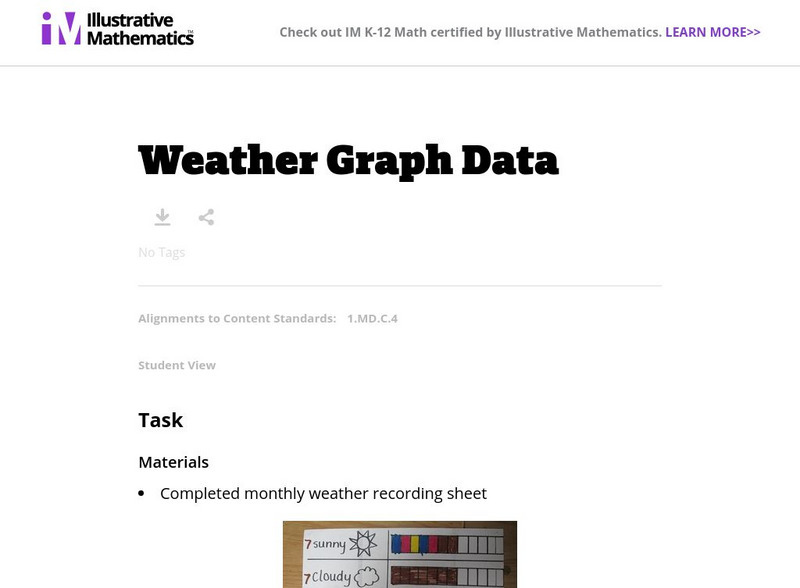
Illustrative Mathematics: Weather Graph Data
The purpose of this task is for students to represent and interpret weather data, as well as answer questions about the data they have recorded. Student worksheets and recording sheet are included.
Texas Education Agency
Texas Gateway: Scientific Investigation and Reasoning Data Organization
Using interactive exercises, students will review how to construct tables and graphs in order to organize data.
University Corporation for Atmospheric Research
Ucar: Weather and Climate Data Exploration
Students explore the relationship between weather and climate by graphing weather temperature data and comparing with climate averages.
University Corporation for Atmospheric Research
Ucar: Get the Picture Severe Weather
Students review graphs and charts of severe weather data then answer "True and False" questions about the content conveyed.
NOAA
Noaa: Outflux: City Climate Comparisons
An interactive comparable climate data tool where the user chooses from a list of United States cities and several weather factors. The immediate result is a graph or graphs of historical US city data.
Better Lesson
Better Lesson: Comparing the Weather
In order to meet Common Core standards, 2nd graders need to be able to interpret data to solve problems. This lesson provides practice in this area. Included in this lesson are a printable temperature chart and a video of second graders...
University Corporation for Atmospheric Research
Ucar: Project Sky Math
Teachers will be interested to explore the SkyMath module, and the 16 classroom activities at this site. In this program, students will collect and record real-time weather data to analyze. Data analysis, graphing, number relationship,...
University Corporation for Atmospheric Research
Ucar: Differences Between Climate and Weather
In this activity, students collect weather data over several days or weeks, graph temperature data, and compare the temperature data collected with averaged climate data where they live.
Alabama Learning Exchange
Alex: What's the Weather Like?
Young scholars will use the Internet to compare the weather forecast for their city with other cities throughout the United States each week during this unit. Data will be charted for a five-day period then analyzed and discussed.
Better Lesson
Better Lesson: Graphing January's Weather
First graders graph the weather in Vermont for the month of January.


