Geographypods
Geographypods: Weather and Climate Graphing It!
Explores the difference between weather and climate and how they are measured. Students will complete activities and construct a climate graph from raw data. They will also learn about the physical structure of the rainforest, its...
Science Education Resource Center at Carleton College
Serc: Drought
Eight online learning labs which focus on the effects of drought, the quiet disaster. Each module takes students to external sites containing data, graphs, and articles. Several labs also require additional software programs: a...
TeachEngineering
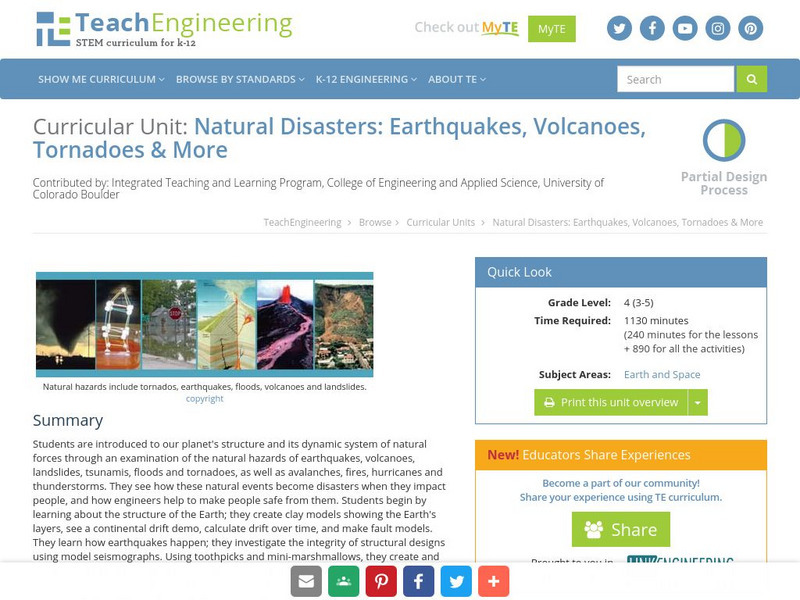
Teach Engineering: Natural Disasters
Students are introduced to our planet's structure and its dynamic system of natural forces through an examination of the natural hazards of earthquakes, volcanoes, landslides, tsunamis, floods and tornados, as well as avalanches, fires,...
Science Education Resource Center at Carleton College
Serc: Do You Really Want to Visit the Arctic?
This jigsaw activity is designed for students to become familiar with several datasets of Arctic weather data, collected in Eureka on Ellesmere Island. Students join a role-playing activity to read and interpret graphs while considering...
Science Education Resource Center at Carleton College
Serc: Introduction to Texas Hurricanes
In this activity, students are asked to graph data about some 20th century hurricanes that hit the Texas coastline. For each graph, they are asked several questions about any apparent correlation between the different variables. Students...
University of Illinois
University of Illinois: Earthquakes of the World
Resource contains a lesson plan that utilizes data from earthquakes. Students are instructed to analyze and interpret line graphs that display the earthquake data.
Science Education Resource Center at Carleton College
Serc: Measuring and Comparing Temperatures
Using thermometers, learners will compare differences in the temperature of various materials and locations. They will record and chart the data that was collected and present the graphs to their classmates.
Other
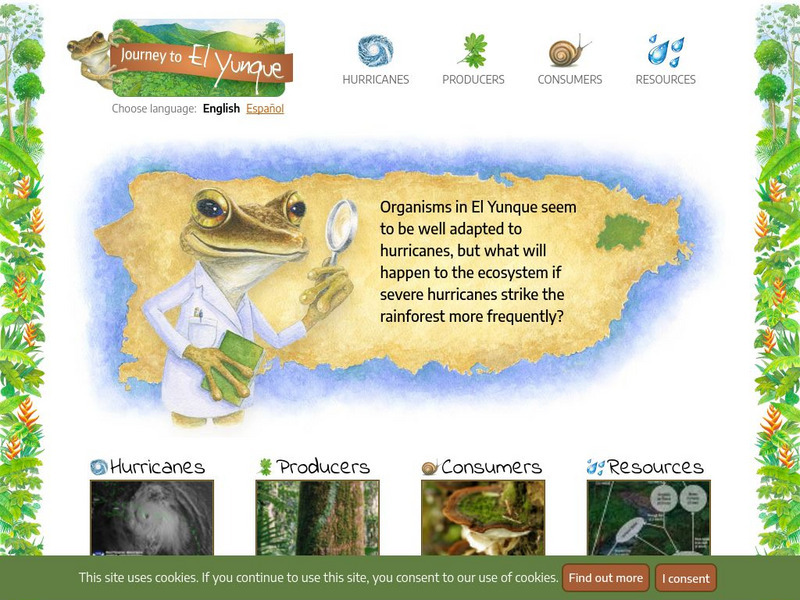
The Learning Partnership: Journey to El Yunque
In this set of learning modules, students examine the impact of hurricane weather on the El Yunque rainforest in Puerto Rico. They learn about hurricanes, producers, consumers, and the food chain, and how disruptions in organisms'...
Texas Instruments
Texas Instruments: Hurricane Hunters: Tracking Katrina and Rita
In this activity students can use data collected on Hurricanes Katrina and Rita to study functions, predictions, and probability models. Students will track the two hurricanes to see how the paths of the hurricanes affected the Gulf...


