Curated OER
How Much Water Is Available In The Atmosphere For Precipitation?
Students explore the relationship between the available water in the atmosphere and how it is portrayed on satellites. After examining global moisture and precipitation students research precipitation data graph the results. Using their...
Curated OER
Measuring and Recording Weather
Students examine instruments used to measure weather, record the data, and post it to an online weather report. They include a 24 hour prediction, keep a weather log, and graph the data.
Curated OER
Water Cycle: Weather Lesson 1
First graders go on a water walk, collect weather data, and measure rainfall for a month. They examine the water cycle in this series of lessons.
Curated OER
Collect the Weather Lesson Plan
Students explore the weather. In this weather spreadsheet instructional activity, students keep track of weather patterns as they use instruments and resources to chart the data the collect in spreadsheet form.
Curated OER
Jumping to Conclusions
Students decide as a class what their data is going to be to graph. In this math lesson, students organize data so that it will be easier to display in a graph. Students are guided through the process by their teachers, and helped with...
Curated OER
The Blizzard of 1993
Students read and interpret the information from a barograph from a major winter storm. This task assesses students' abilities to interpret and analyze graphs, construct data tables and graphs, generalize, infer, apply knowledge of...
Curated OER
Hurricanes and Climate
Students investigate maps and data to learn about the connections between hurricanes and climate. In this exploratory lesson students describe and graph the 6 regions where hurricanes happen and discuss how hurricanes have changed over...
Curated OER
Weather Watchers
Students are introduced to an Underground Weather Stations. In groups, they use the internet to research the weather in different parts of the United States locating each city. To end the lesson, they summarize the information they...
Curated OER
How's The Weather?
Students make a box and whiskers plot using the TI-73 graphing calculator. Each student would have their own calculator but they would work in small groups of two or three to help each other enter the data and make the plots.
Curated OER
Excel temperature Graphs
Students gather data about the weather in Nome, Alaska. In this Nome Temperature lesson, students create an excel graph to explore the weather trends in Nome. Students will find the average weather and add a trend line to their graph.
Curated OER
Climographs
Students identify trends and characteristics of climate zones and specific places within. Then, they graph annual climate trends (primarily Temperature and Precipitation) and create, interpret and extrapolate information based on...
Curated OER
Shedding Light on the Weather with Relative Humidity
Learners study weather using a graphing calculator in this lesson plan. They collect data for temperature and relative humidity for every hour over a day from the newspaper, then place the data in their handheld calculator and examine it...
Curated OER
Our Desert Backyard
Students make observations of their own backyard. In this environment lesson, students keep records of the plants and animals they see in their home or school yard. Students make notes of how the weather and environment changes over...
Curated OER
Climate Systems - Which Location Is Best For Me?
Students study the difference between weather and climate. In this climate systems lesson students search the Internet for the parts of the Earth's system, gather climate data and complete a challenge scenario.
Curated OER
Canada's Climate: Temperature and Rainfall Variations
Students analyze data about various climates in Canada. In this data analysis and climate lesson, students use Canada Year Book 1999 to complete a worksheet and make connections between precipitation and temperature in different climates.
Curated OER
Countdown to Disaster
Students discover the potential dangers of weather in their hometown. In this environmental lesson, students research Hurricane Hugo and the devastation it caused South Carolina in 1989. Students record weather data from their city and...
Curated OER
Probing Under the Surface
Eighth graders use a measuring stick to determine the shape of the inside of the bottom of a box, then apply their knowledge to an additional situation. This task assesses students' abilities to make simple observations, collect and...
Curated OER
Weather Observation Journal
Students record weather for a period of one month. In this weather lesson, students observe weather for one month on a large pictograph. Students record clouds, wind, temperature and any other weather conditions they observe. Students...
Curated OER
Weather and its Effect on the Environment and Settlement
Students, after choosing two diverse cities, collect data on weather for a month and construct a graph on temperature and precipitation. After collecting population data of said cities, and graphing it, they plot population on a large...
Curated OER
Using Radiosonde Data From a Weather Balloon Launch
Student use radiosonde data from a weather balloon launch to distinguish the characteristics of the lower atmosphere. They learn the layers of the atmosphere. They graph real atmospheric data.
Curated OER
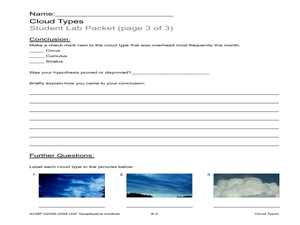
Cloud Types
Students examine cloud types. In this cloud lesson, students identify cloud types, observe clouds and collect data, and analyze data to identify the most common cloud they observe overhead during the course of a month.
Curated OER
Weather Instrument Data Chart 2
In this science worksheet, students look for the data that is needed to fill in the graphic organizer. The prefixes are given that are needed to sort the information as it is collected.
Chicago Botanic Garden
Historical Climate Cycles
Ice core samples give scientists access to climates of old—those from more than 800,000 years ago. Through an analysis of various temperature graphs from ice cores, tree rings, and weather stations, scholars compare historical climates...
Polar Trec
Global Snow Cover Changes
Snow is actually translucent, reflecting light off its surface which creates its white appearance. Pairs or individuals access the given website and answer questions about snow cover. They analyze graphs and charts, examine data, and...


