Curated OER
The Fabled Maine Winter
Learners graph and analyze scientific data. In this research lesson plan students use the Internet to obtain data then draw conclusions about what they found.
Curated OER
Differences Between Ground and Air Temperatures
Students examine the differences between air temperature and ground temperature. In this investigative instructional activity students find NASA data on the Internet and use it to create a graph.
Curated OER
Solar Cell Energy Availability From Around the Country
Young scholars determine areas that are the most likely to produce solar energy by using NASA data. In this solar energy instructional activity students analyze plots and determine solar panel use.
World Wildlife Fund
Land of the Midnight Sun
From days of 24 hour sunlight, to endless nights that last for days, the Arctic is a very unique place to live. Examine the seasonal changes that occur in the northern-most reaches of the globe and the impact they have on the plants and...
Curated OER
Weather v. Climate
Ninth graders discuss the differences between climate and weather as a class. Using data they collected, they create a graph of the data to share with the class over a specific time period. They compare and contrast this data with...
Curated OER
MAISA and the REMC Association of Michigan
Students complete online research to study geography's impact on weather. In this geography and weather lesson, students research weather in their city for ten days using an online website. Students bookmark the site, enter data into a...
Curated OER
Weather Conditions During the Fall Monarch Migration
Students keep detailed weather records during the fall migration of the monarch butterfly. They compare weather conditions to the days they do and do not see monarchs. As a class, they graph and analyze data and send it to a university...
Curated OER
Weather "Why"
Students research weather and explore how to use their research information. In this weather information lesson, students visit a given website for weather forecasts. Students graph the weather, sing weather songs and select a class...
Curated OER
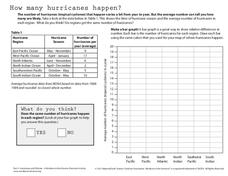
How Many Hurricanes Happen?
In this hurricanes instructional activity, students use a data table showing the hurricane region and the average number of hurricanes per year to determine if the same number of hurricanes happen in each region by creating a graph. Then...
Curated OER
Graph and Compare the Adventure's Temperature Vs. Local Temperature
Students explore the concept graphing data. In this graphing data lesson, students use weather data from their local weather and some other city and graph them. Students plot the local weather vs. another city. Students record...
Curated OER
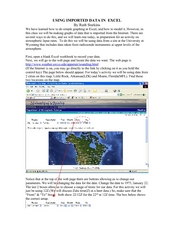
Using Imported Data in Excel
Students import atmospheric data from the internet. In this earth science lesson, students graph the data they collected. They complete the worksheet after the activity.
Curated OER
Weather Watchers
Second graders discuss what weather is and list words that can be used to describe weather. In this science lesson, 2nd graders develop symbols for each type of weather and record the weather for two weeks at the same time and the same...
Curated OER
Do the Elephants Need Sunscreen? A Study of the Weather Patterns in Etosha
Learners analyze the weather patterns in Namibia. They create a graph of the yearly temperatures and use the internet to gather information. They discuss how the weather goes in cycles in the area.
Curated OER
Chances Are
Upper graders examine the concept of probability. They collect data and create a bar graph. They must interpret the data as well. Everyone engages in hands-on games and activities which lead them to predict possible outcomes for a...
Discovery Education
Sonar & Echolocation
A well-designed, comprehensive, and attractive slide show supports direct instruction on how sonar and echolocation work. Contained within the slides are links to interactive websites and instructions for using apps on a mobile device to...
Curated OER
Using Computers for Statistical Analysis of Weather
Students use temperature, cloud cover and other weather data from the S'COOL website to statistically analyze weather around the country. They use computers to calculate and graph standard deviations, means and modes of the weather...
Curated OER
I'm a Weather Watcher Watching plants grow by......my,my,my
Students investigate how weather affects how plants grow. They collect data on weather and plant growth for a week and display the data on a graph. For a culminating experience they design a movie using software that shows plant growth...
Curated OER
Graphing Temperatures
Students identify current temperatures for different regions of the United States. Using current information, they develop hypothesis for the temperature in the same region tomorrow. They use the Weather Channel website to find actual...
Curated OER
Weather in Your City
Students observe weather conditions of a particular city. Multiple intelligences are explored within this lesson. They locate their particular city on a United States map. Each student writes about their discoveries in his/her journal...
Curated OER
Observing Weather
Students investigate the weather by reading children stories. For this weather observation lesson, students read Cloudy With a Chance of Meatballs and several other stories about weather before they create a KWL chart. Students utilize...
Curated OER
Daily Weather Calendar
Third graders use the internet to record the daily weather conditions. Using symbols, they take the information they gathered and create an easy to read chart. They share their charts with the class to end the activity.
Curated OER
Chucky Chickadee's Bird and Breakfast: Sing in Please
Students observe bird feeding and complete a tally and graphing activity for their observations. In this bird graphing lesson plan, students work in teams to observe bird feedings. Students complete a bird reporting sheet and collect...
Curated OER
Weather
Students participate in a variety of mini-lessons including experiments, literature readings, physical education components, music, data gathering and recording and more to expose them to several themes of weather; i.e. water cycle,...
Curated OER
Effects of Temperature, Deviation on Climate
Young scholars collect and record data for a given city. They calculate standard deviation of temperature and analyze the impact of climate changes on a city's and culture.


