Curated OER
Phenomenal Weather-Related Statistics
Eighth graders research, collect and interpret data about weather statistics. They record that data on spreadsheets. they create Powerpoint presentations on their individual or group research.
Curated OER
Calendar & Weather Book
Second graders track weather patterns through the school year. They take daily readings and record them in a weather book.
Curated OER
Weather Conditions During The Fall Monarch Migration
High schoolers keep detailed weather records during the fall migration. If they are also Observing Fall Migrants, they will be able to compare weather conditions on days that they do and do not see monarchs. Having a class record of...
Curated OER
Wet Weather, Wet Climate
Students discover the differences between weather and climate in this long-term lesson introduction. They create rain gauges and practice reading rainfall measurements, view a website showing the cloud cover in their location and draw...
Curated OER
Comparing Temperature, Pressure, and Humidity
Students investigate data on temperature, pressure, and humidity by downloading information from the ARM Website. Working in groups, they discover how weather impacts life in each of the ARM sites. They record weather data in their...
Teach Engineering
Maximum Power Point
Investigate the maximum power output of a photovoltaic panel with a lesson that introduces the class to the maximum power point. Individuals learn how to determine the maximum power point of a solar panel by using Ohm's law and the power...
Curated OER
Hurricanes on Track
Fifth graders develop a questionnaire to investigate weather in different part of the US. They investigate how weather in one part of the country affects weather in another part. They predict the development of hurricanes.
Curated OER
The Mysteries of El Nino: How Much do We Really Know?
Seventh graders investigate the causes and effects of El Nino and explore its global impact on weather related occurrences through this series of activities.
Curated OER
Reading A Weather Map
Ninth graders construct a weather map. In this meteorology lesson, 9th graders construct a weather map using contour lines and temperature.
Curated OER
Creeping
Young scholars observe, measure, and graph a model of slow down slope movement representing soil creep. This task assesses students' abilities to collect, record, and organize data, set up graph axes, plot data points, draw line graphs,...
Curated OER
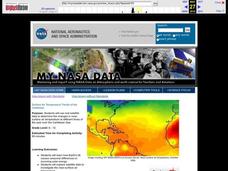
Surface Air Temperature Trends of the Caribbean
Students investigate the seasonal changes to sea surface and near-surface air temperatures near the equator. They use actual satellite data to track and graph the differences in air and sea temperatures during different seasons in the...
Curated OER
Ocean Botttom Profile
Students interpret a graph of ocean depths and topographic features. This task assesses students' abilities to interpret figures, organize and represent data, apply knowledge of scale to a profile, and apply theoretical knowledge.
Curated OER
The Effect of Rain on Morning Temperatures
Eighth graders study the effects of the water cycle. They create a graph of the air temperature versus solar radiation on a rainy and clear 24 hour period using data from a provided link. Afterward, they answer questions to determine the...
Curated OER
Historical Temperatures
Students research historical regional temperatures for their current season. In this historical weather instructional activity, students conduct weather station and Internet research to learn about historical regional temperatures....
Curated OER
Circle the Earth - Explore Surface Types on a Journey around Earth
Students use CERES percent coverage surface data with a world map in locating landmasses and bodies of water at Earth's Equator.
Curated OER
Basic Excel
Students explore basic Excel spreadsheets. In this spreadsheet lesson plan, students enter Alaska weather information and perform calculations. Students title the columns on the spreadsheet and format the cells. Students complete...
Curated OER
Weather Conditions During the Spring Monarch Migration
High schoolers keep a detailed record of weather patterns during the spring migration of the monarch butterfly. The use of weather reports is used to form a class data sheet. This lesson connects to the skills of graphing and critical...
Curated OER
Surface Meteorological Observation System (SMOS)
Students monitor local surface weather conditions for at least 30 days. They interpret the data by graphing it and detemining percentages.
Curated OER
Highs and Lows
Students use email to chart weather patterns and then graph their findings. In this weather patterns lesson, students chart their weather for a week at the school. Students then use email to find temperatures at a variety of locations....
Curated OER
Weather Or Not
Young scholars use the internet to find pen pals to share in their weather experiment. Individually, they research the high and low temperatures for cities within the United States and email the results to their pen pal. They also...
Curated OER
Predicting Monthly Precipitation
Students should log onto, and collect data from, a specific site on the Internet. They average and compare the data using the Excel spreadsheet program, make predictions from their data, and determine the percent error of their predictions.
Curated OER
Temperature High and Lows
Learners gather high and low temperature readings through email. For this temperature graphing lesson, students use a spreadsheet to input data for a graph. learners interpret the graphs to compare and contrast the data from different...
Curated OER
Flight of Angles of Inclination
Students measure the flight of a gilder. In this fight of angles instructional activity, students explore the flight of a glider and measure the distance flown. They collect statistical data of the flights and determine the slope of...
Curated OER
Temperature in the Sun or Shade of the Desert
Third graders use thermometers to measure the air temperature in several
places around the school and then return to the classroom to record the data. They create a bar graph and discuss their findings about the air temperature in the...


