Curated OER
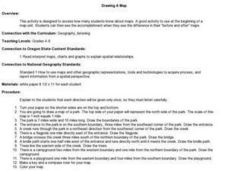
Drawing A Map
Students discuss any information they already know about maps. As a class, they draw a map of a park following written directions making sure to include a compass rose and key. They are graded based on a rubric and discuss the need for...
Curated OER
Line Graphs 4
In this graph worksheet, students interpret given line graphs. They determine the range, and identify the range in a set of data. This one-page worksheet contains approximately 14 problems.
Curated OER
Map Skills
Students examine the nations, battlefields, troop movement of the Germans through Belgium and the location of both fronts during World War I by creating a map. They visualize the strength of the Germans early in the war.
Curated OER
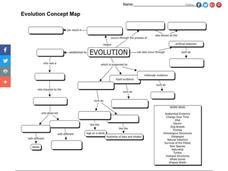
Evolution Concept Map
In this evolution concept map worksheet, 7th graders use the vocabulary terms related to evolution to complete the evolution concept map.
Curated OER
Virtual Field Trip
This hands-on resource has future trip planners analyze graphs of mileage, gasoline costs, and travel time on different routes. While this was originally designed for a problem-solving exercise using a Michigan map, it could be used as a...
Curated OER
This is My Neighborhood
Students predict the things that they may see, smell, or hear in their neighborhood. They take part in a neighborhood walk, creating a rough map of their neighborhood as they go. Upon return to the classroom, students create a final map...
Curated OER
Virtual Field Trip
Are we there yet? Young trip planners learn about their state and plan a trip. They will select sites to see in three cities in their state, and record associated costs in a spreadsheet. While this was originally designed as a...
Curated OER
Hawaii: A Stolen Star
Explore the islands of Hawaii. Investigate Hawaiian culture and compare their personal traditions to Hawaiian traditions. They locate Hawaii on a map and research the history of Hawaii.
Consortium for Ocean Science Exploration and Engagement (COSEE)
Climate Change Impacts on Blue King Crabs
Carbon dioxide is not only causing global temperatures to increase, it causes the oceans to become more acidic. Lesson focuses on the blue king crab and the fragility of the habitat due to climate change. Scholars create a concept map...
Curated OER
Aerosol Lesson: Science - Graphing SAGE II Data
Students examine and plot atmospheric data on bar graphs.
Curated OER
Landscape Picture Map
Learners design a landscape picture map. In this landscape picture mapping lesson, students understand when and why to use a landscape picture map. Learners discuss landscape picture maps.
Curated OER
Tables, Charts and Graphs
Young scholars examine a science journal to develop an understanding of graphs in science. In this data analysis lesson, students read an article from the Natural Inquirer and discuss the meaning of the included graph. Young...
Curated OER
Map Creation
Second graders identify a map, symbol, key, and compass rose. Students create and print a map for teacher evaluation using the computer. Students identify the symbols on their map and orally present them to the class.
Curated OER
Map Reading
After examining a map from 1803 and 2003, they explore how to become map readers. They describe what they see on the map from 1803 and compare the information to the map from 2003. Students create their own map of the neighborhood that...
Curated OER
Solving the Puzzle
Students create a map showing the United States borders at a specific period in history and produce three questions to be answered by examining the map. They also write a productive paragraph explaining who, what, when, where, how/why a...
Columbus City Schools
What is Up Th-air? — Atmosphere
Air, air, everywhere, but what's in it, and what makes Earth's air so unique and special? Journey through the layers above us to uncover our atmosphere's composition and how it works to make life possible below. Pupils conduct...
Curated OER
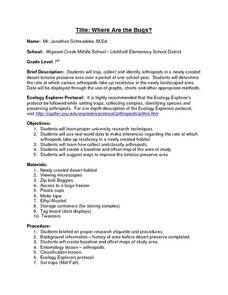
Where Are the Bugs?
Students trap, collect and identify arthropods in a newly created desert tortoise preserve area over a period of one school year. They determine the rate at which various arthropods take up residence in the newly landscaped area. Data is...
Curated OER
Graphing Regions: Lesson 2
Learners identify and analyze geographical locations of inventors. They each identify where their inventor is from on a U.S. map, discuss geographic patterns, and create a t-chart and graph using the Graph Club 2.0 Software.
Curated OER
Is there a map in that story?
Eighth graders examine different pieces of literature from specific isolated Pacific islands. In this Geography lesson, 8th graders read and interpret a written selection. Students construct a map of the stories setting.
Curated OER
Lesson 3: Seven Day Road Trip
Students plan a seven day road trip. In this travel instructional activity, students plan a driving trip that includes five major cities or attractions in Florida or another state of their choice. They show the trip on a map, calculate...
Curated OER
Surveying the Land
Students explore the different kinds of maps and the purpose of each. In this Geography lesson, students work in small groups to create a map which includes the use of a map key.
Curated OER
Analyze This
Students gain practice in the analysis of various types of graphs common in daily life. These examples often use graphic images like charts, graphs, tables, and pictures to supplement learning.
Curated OER
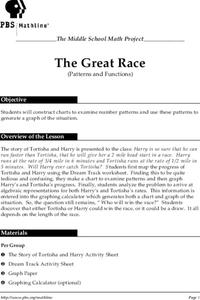
The Great Race
Students are presented with a story about two individuals running a race in which one is given a head start. Students must map the progress of the runners, create a chart examining patterns and graph the progress. In the end, students...
Curated OER
Maps, Charts, and Graphs
Students define key geographic terms and track a hurricane on a map. They examine various types of maps and find locations on them,including rivers, cities and mountains.
Other popular searches
- Maps Graphs and Charts
- Charts, Graphs, Maps
- Maps, Charts, Graphs, Tables
- Charts, Maps, Graphs
- Charts, Maps and Graphs


