Curated OER
Graphing My Path to Success
Seventh graders examine their school performance through self-assessment of strengths and weaknesses. They construct a line graph, plotting all courses and achievements. Students use graph paper and colored pencils for each activity. If...
Curated OER
Linear Functions: Slope, Graphs, and Models
This math packet provides an opportunity for learners to graph two linear equations on a coordinate grid and determine the slope and y-intercept of each. They use the equation of five lines to find the slope and y-intercepts, and then...
Curated OER
Graphing
In this graphing worksheet, students solve and graph 10 different problems that include determining various coordinates and the slope. First, they use the table to write the x and y coordinates for each point on the graphs. Then,...
Curated OER
Graphing Ordered Pairs
Here is graphing worksheet which has pupils graph ordered pairs and label the axis. They graph five ordered pairs and then interpret the data in the graph.
Curated OER
Graphs
In this algebra worksheet, students solve three linear equations to by substitution to determine if the given point is a solution. Students graph and determine the slope and y-intercept of 5 linear equations.
Curated OER
Graphing Linear Equations
Use this graphing worksheet to have learners evaluate and graph linear equations. A coordinate plane, for graphing, is provided below each equation. This one-page worksheet contains seven problems.
Curated OER
Tim and Pat at the Store: Bar Graphs
Do you like candy? Tim and Pat go to the candy store every day after school. Can you use the chart to determine how much money they spend each day? Does one spend more than the other?
Curated OER
Graphs and Data
Students investigate poverty using graphs. In this algebra lesson, students collect data on the effects of poverty and use different rules to analyze the data. They graph and use the trapezoid rule to interpret the data.
Curated OER
Graphing Inequalities
In this graphing inequalities worksheet, students solve and graph 10 different problems that include various inequalities. First, they study each of the examples given. Then, students graph the remaining equalities and inequalities as...
Curated OER
Graph Logarithmic Functions
Practice graphing with this learning exercise. High schoolers solve logarithms and graph the solution. This one-page learning exercise contains eight problems, varying in complexity.
Curated OER
Graph of a Function
In this graph of a function worksheet, students graph a function and find the value at a given point. They determine the absolute minimum and maximum of an interval. This two-page worksheet contains three problems.
Curated OER
Domian and Range of Graphs
High schoolers determine the domain and range of various graphs using a graphing calculator. Given a set of graphs to analyze, learners calculate the range and domain of the graphs by plotting the graphs on their calculators. Downloads...
Math Mammoth
Line Graphs 3
For this line graphs learning exercise, students make a triple-line graph from a list of given data and then answer three comprehension questions regarding the line graph.
Mathed Up!
Conversion Graphs
After watching a video on conversions, learners convert meters to feet, dollars to pounds, pounds to Euros, gallons to liters, and kilometers to miles. Then, they graph the conversion changes onto graph templates.
West Contra Costa Unified School District
Graphing Systems
Get hands on with solving systems of equations graphically. A solid lesson plan uses guided practice to show how to solve systems of linear equations. It allows time for sharing ideas and provides a printable matching activity to promote...
Physics Classroom
Dots and Graphs
Scholars demonstrate understanding of kinematic graphs through matching dot graphs to position time graphs, dot graphs to velocity graphs, and a mixture of the two. If users feel stuck or confused, a Help Me! button offers an explanation...
Curated OER
Graphing of Speed vs. Time
In this acceleration worksheet, students use the date given to create 2 different speed vs. time graphs. Then students use the graphs to complete 15 short answer questions.
Curated OER
Straight Line Graphs
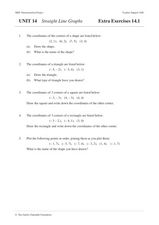
In this algebra instructional activity, students graph coordinate pairs on a coordinate plane. They match points with letters and graph a line through all the plotting to create a straight line. There are 25 questions with an answer key.
Curated OER
Straight Line Graphs
In this line graphs learning exercise, students draw lines for 9 problems then solve 9 additional problems relating to line graphs. Answers are included.
Curated OER
Graphing Inequalities in One Variable
Students graph inequalities on a number line. In this algebra lesson, students solve linear and compound inequalities and graph them on a number line. They write an inequality given the number line with the solution on it.
Curated OER
Graphing Standard Form Inequality
Students solve equations and graph it. In this algebra lesson, students solve inequalities and rewrite them in the slope intercept form. They graph the boundary lines first either as dashed or solid and shade the correct side of the line.
Curated OER
Graphing Inequalities
Young scholars solve inequalities and graph. In this algebra instructional activity, students rewrite inequalities in the slope intercept form and graph using the slope and intercept. They shade the correct side of the line using greater...
Flipped Math
Piecewise Functions
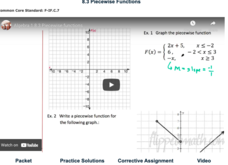
Break it up into pieces to solve the problem. Individuals watch a video on how to graph and determine the equation and values of piecewise functions. Viewers then work several exercises to practice evaluating a piecewise function at...
Math Mammoth
Circles Graphs and Percents
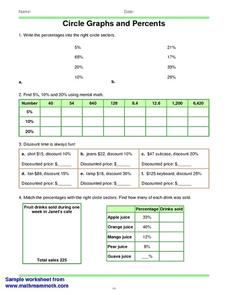
In this percent instructional activity, students read and interpret circle graphs. They determine discounts, and match percentages with circle sectors. This one-page instructional activity contains approximately 30 problems.
Other popular searches
- Charts and Graphs
- Bar Graphs
- Line Graphs
- Double Bar Graph
- Circle Graphs
- Pie Charts and Graphs
- Picture Graphs
- Coordinate Graphs
- Skittles Bar Graph
- Reading Charts and Graphs
- Blank Coordinate Graphs
- Percent Circle Graph


