Curated OER
Graphing the Diversity of a Forest
Second graders work in groups to identify what types of trees create which types of leaves In this plant life lesson plan, 2nd graders analyze a set of leaves and identify the tree it came from while graphing the data in a science...
Curated OER
The Graph of a Quadratic Function
In this Algebra I/Algebra II worksheet, students graph quadratic functions. The five page worksheet contains a combination thirteen multiple choice and free response questions. Answers are included.
Curated OER
Solving a Pair of Linear Equations by Graphing
Teach your math lovers how to solve linear equations by graphing. Students identify pairs of coordinates and use it to graph a line and use the TI to graph and observe the line.
Curated OER
Leveled Problem Solving: Circle Graphs
For this circle graphs worksheet, students solve 6 word problems based on a circle graph about the most popular classes for sixth graders. Students calculate angle measures of circles for 2 of the problems.
Curated OER
Graphs and Derivatives
In this graphs and derivatives worksheet, students graph the derivative of a function. They find the intervals and identify the maximum and minimum. This one page worksheet contains three multi-step problems.
Curated OER
Weather Graph
In this graphing activity, students read the average monthly maximum and minimum temperatures in Paris and use them to complete a color coded line graph. Students graph 24 figures.
Curated OER
Graphs involving Exponential Functions
In this algebra worksheet, students graph exponential functions and analyze it for growth and decay. There are 9 problems with an answer key.
Curated OER
Graph Logarithms
Mathematicians graph logarithmic equations. Teach your students how to identify the intercepts of logarithmic equations and tell whether the function is increasing or decreasing. They find the domain and range of each function.
Curated OER
Weather, Data, Graphs and Maps
Students collect data on the weather, graph and analyze it. In this algebra lesson, students interpret maps and are able to better plan their days based on the weather reading. They make predictions based on the type of clouds they see.
Curated OER
Concavity of a Graph
Learners explore the graph of a function. In this calculus lesson, students identify when and where the graph is increasing or decreasing. They identify if it concave up or down by moving the cursor.
Curated OER
Exploring Graphs of Inequalities
Learn how to solve inequalities and graph their answers. Students use addition, subtraction, multiplication and division to solve problems. They analyze their graph using the TI calculator.
Curated OER
Do You Like Cold Or Hot Lunch Better?: Graph
In this bar graph worksheet, students will ask classmates if they prefer hot or cold lunch and record answers to complete the graph.
Curated OER
Which Month Do You Like the Best?: Graph
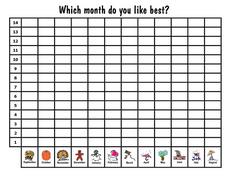
In this favorite month graph, students will ask their classmates which month is their favorite and record the responses to complete the bar graph.
Curated OER
How Tall Are You?: Graph
In this height bar graph worksheet, students will ask their classmates how tall they are and record the responses to complete the graph.
Curated OER
Are You the Youngest, Oldest Or Middle Child?: Graph
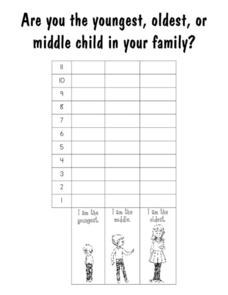
In this family order graph worksheet, students will ask their classmates if they are the youngest, oldest, or middle child in their family and record the responses to complete the graph.
Curated OER
Reading Bar Graphs
In this bar graphs worksheet, 8th graders solve and complete 10 different problems that include interpreting two different bar graphs. First, they determine the least profitable year for selling books. Then, students determine the age...
Curated OER
What Do You Like To Do the Most After School?-- Class Bar Graph
For this math worksheet, students collaborate to make a class bar graph which will display data on favorite leisure time activities. Students survey their classmates and plot the results on the graph. Six choices are given: games, read,...
Curated OER
Do You Like To Color With Crayons, Markers, Or Colored Pencils?: Graph
In this bar graph worksheet, students will ask classmates what they like to use when coloring: crayons, markers or colored pencils? Then students will record the responses to complete the bar graph.
Curated OER
If You Were a Community Helper for a Day, Which One Would You Like To Be?-- Class Bar Graph
For this math worksheet, learners collaborate to make a class bar graph. Students choose from a list of 12 occupations they are interested in and plot the information on the graph.
Curated OER
What Sport Do You Like To Play the Most?== Class Bar Graph
In this math worksheet, students participate in making a group bar graph about their favorite sports. Students are surveyed and the responses plotted on a graph.
Curated OER
Which Places Have You Visited?: Graph
In this bar graph worksheet, students will ask their classmates which places they have visited before and record responses to complete the graph. There are 6 generic places from which to choose.
Curated OER
Which Letters Are in Your First Name?: Graph
In this first names bar graph worksheet, students will ask their classmates which letters are in their first names and record the responses to complete the graph.
Curated OER
Do You Like Breakfast, Lunch, Or Dinner Best?: Graph
In this favorite meal bar graph worksheet, students will ask their classmates which meal they prefer and then record responses to complete the graph.
Curated OER
What Does Your Bean Seed Look Like Today?-- Class Bar Graph
In this math/science worksheet, students who are already beginning to grow a bean seed record what it looks like on a given day. Detailed pictures of different growth stages are provided on the class graph.
Other popular searches
- Charts and Graphs
- Bar Graphs
- Line Graphs
- Double Bar Graph
- Circle Graphs
- Pie Charts and Graphs
- Picture Graphs
- Coordinate Graphs
- Skittles Bar Graph
- Reading Charts and Graphs
- Blank Coordinate Graphs
- Percent Circle Graph


