Curated OER
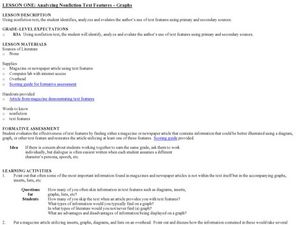
Analyzing Nonfiction Text Features - Graphs
Students examine the text features of non-fiction. In this literacy lesson, students practice reading graphs and discover the authors intent for using them in primary and secondary sources.
Curated OER
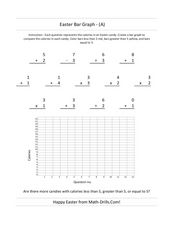
Easter Bar Graph- A
In this Easter math worksheet, students first solve 13 problems with addition, subtraction, multiplication and division. Using the answers, students make a bar graph.
Curated OER
Easter Bar Graph - C
In this math review worksheet, learners complete addition, multiplication, division, and subtraction problems where each answer is inserted into a bar graph. Students complete 13 problems.
Curated OER
Easter Bar Graph - (E)
In this math review worksheet, students complete addition, multiplication, division, and subtraction problems where each answer is put into an Easter bar graph. Students complete 13 problems.
Curated OER
Easter Bar Graph - (D)
In this math review worksheet, students complete addition, multiplication, division, and subtraction problems where each answer is put into an Easter bar graph. Students complete 13 problems.
Curated OER
Discovering Magnets and Graphs
Sixth graders investigate averages and statistics by discovering magnet strengths. In this magnet experiment lesson, 6th graders utilize different magnets and attempt to attract different materials to them. Students record...
Curated OER
Linear Graphs and Equations
In this linear graphs and equations activity, students examine points on a graph and identify coordinates plotted on the point. Students determine the slope of a line and write the equation of a line. This three-page activity contains 20...
Curated OER
Graphing Trash Material
Young scholars investigate data and recyclable materials. In this math lesson, students save recyclable materials and create a graph of the materials. Young scholars discuss how they could help the environment by recycling.
Curated OER
Bar Graphs with Tally Marks
Students classify buttons into categories, create and interpret a tally table and bar graph, and add and subtract numbers.
Curated OER
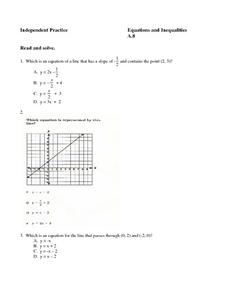
Equations: Graphs, Lines, Slope
In this equations worksheet, students complete 8 multiple choice questions regarding writing equations in slope-intercept and matching an equation to its graph in the coordinate plane.
Curated OER
Graph Paper 2
In this blank graph paper worksheet, learners use the gridded sections that may be marked off on the x and the y axis as directed by their teachers.
Curated OER
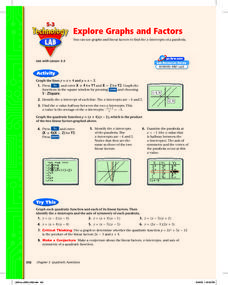
Explore Graphs and Factors
Pupils graph the factors of a quadratic as linear equations and graph the parabolic equation in factored form. Also, they investigate the relationship between the x-intercepts of the lines and the zeros of the parabola.
Curated OER
Mass/Weight/Data/Graphing-What Is The Mass of a Dinosaur?
Students determine the mass of various "dinosaur eggs" and graph their data. In this mass, weight, data and graphing lesson plan, students measure the mass of different weighted "dinosaur eggs". They record their data and transfer it to...
Raytheon
Equations and Graphing Review
In this equations and graphing review instructional activity, learners write, graph and solve equations for 62 problems, including a mid-unit review, with answers included.
Curated OER
Reciprocal Graphs
In this graphing activity, learners graph 8 reciprocal graphs. Students graph the reciprocal of a given graph. Learners graph reciprocal cubics, quadratics, linear, circles, and fourth degree functions.
Curated OER
Froot Loop Graph
In this froot loops graph worksheet, students graph the colors of the fruit loops they have. Students graph 6 colors of fruit loops on the graph.
Other popular searches
- Charts and Graphs
- Bar Graphs
- Line Graphs
- Double Bar Graph
- Circle Graphs
- Pie Charts and Graphs
- Picture Graphs
- Coordinate Graphs
- Skittles Bar Graph
- Reading Charts and Graphs
- Blank Coordinate Graphs
- Percent Circle Graph


