Curated OER
Identifying Ozone Variations over Different Locations
Learners analyze ozone data. In this atmosphere lesson, students will use a NASA resource to gather data for different regions of the Earth. Learners will then create a graph for their data and answer related questions.
Pace University
Grade 7 Earth Day Statistics with Circle and Bar Graphs
Take a tiered approach to studying waste. The lesson uses Earth Day to present differentiated instruction around using circle and bar graphs. Each group gets a cube based on their tiers and works collaboratively as well as individually...
NASA
Cloudy vs. Clear - Graphs
Explore the link between solar energy and cloud cover using real data from NASA from China! Future climatologists analyze and interpret graphs of solar energy on clear and cloudy days using a literacy cube. Investigators draw conclusions...
Curated OER
Fishy Behavior
Here's a lab that may make you rethink that morning cup of coffee. Biology scholars test the effects of caffeine, alcohol, and nicotine on the behavior of zebrafish through an intriguing experiment. Learners observe fish behavior before...
EngageNY
Revisiting the Graphs of the Trigonometric Functions
Use the graphs of the trigonometric functions to set the stage to inverse functions. The lesson plan reviews the graphs of the basic trigonometric functions and their transformations. Pupils use their knowledge of graphing functions to...
Curated OER
Canada at a Glance
Stjudents examine the statistics in a Canadian publication for use in graphs. They develop their own questions based on tables and graphs found in this publication..
Curated OER
Collecting Data and Graphing
Young mathematicians collect data and graph it. They work collaboratively to collect data regarding the span of arm length versus height and graph the data they collect.
Curated OER
What's Up With My Class
Learners collect data about their class and they use Excel spreadsheet to display their tables and graphs about the class. They answer survey questions and collect their data. Students create a graph of their choice to display the...
Curated OER
Getting the Lead Out
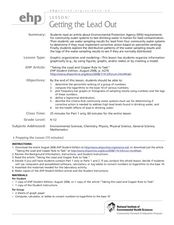
The article for this instructional activity no longer accessible through the links in the lesson plan, but can be found in the National Center for Biotechnology Information website. After reading it, environmental science high schoolers...
Curated OER
Bungee Jump Lab
Student apply linear relationships to the real world. They use Ken and Barbie dolls and experiment to find the line of best fit. They collect data, analyze data, and make predictions from it. The learners also use Microsoft Power Point...
Curated OER
Valentine Hearts Investigation
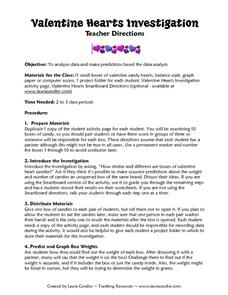
Students practice analyzing data and making predictions. For this 2nd - 3rd grade lesson plan, students investigate and compare data gathered using boxes of valentine candy hearts. Students examine the different boxes of candy...
Curated OER
Does cloud type affect rainfall?
Student use MY NASA DATA to obtain precipitation and cloud type data. They create graphs of data within MY NASA DATA. Students compare different cloud types, compare precipitation, and cloud type data They qualitatively describe graphs...
Curated OER
The Power of Graphical Display: How to Use Graphs to Justify a Position, Prove a Point, or Mislead the Viewer
Analyze different types of graphs with learners. They conduct a survey and determine the mean, median and mode. They then identify different techniques for collecting data.
Polar Trec
Ozone Data Comparison over the South Pole
Did you know the hole in the ozone is seasonal and filled by January every year? The lesson uses scientific measurements of the ozone over the South Pole to understand patterns. Scholars learn that the hole grew bigger annually before...
Curated OER
Linear Regression and Correlation
Learners explore scatter plots. For this linear regression lesson, groups of pupils graph scatter plots and then find the line of best fit. They identify outliers and explain the correlation. Each group summarizes and shares their...
EngageNY
Linear and Exponential Models—Comparing Growth Rates
Does a linear or exponential model fit the data better? Guide your class through an exploration to answer this question. Pupils create an exponential and linear model for a data set and draw conclusions, based on predictions and the...
Curated OER
Populations Lab - Cultures Lesson: Statistics / Sampling Patterns
Ninth graders examine the application of statistical sampling, data collection, analysis, and representation that exists in schooling and teenage lifestyles in Japan and the United States.
Bowland
Mystery Tours – Plan Your Tour
Everyone loves a vacation and a set of three activities has groups planning a tour of the U.K. using given distance, time, and price data. They solve a variety of problems related to the trip and produce a report on the success of the trip.
Curated OER
School Activities
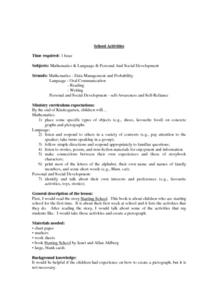
First graders place some specific types of objects (e.g., shoes, favorite food) on concrete graphs and pictographs. They listen and respond to others in a variety of contexts (e.g., pay attention to the speaker; take turns speaking in a...
Curated OER
Fish Communities in the Hudson
Learning to read data tables is an important skill. Use this resource for your third, fourth, or fifth graders. Learners will will study tables of fish collection data to draw conclusions. The data is based on fish environments in the...
Curated OER
Temperature Bar Graph
Students explore mean, median and mode. In this math lesson, students analyze temperature data and figure the mean, median, and mode of the data. Students graph the data in a bar graph.
Curated OER
Histograms and Bar Graphs
Students examine the use of bar graphs and histograms. In this data representation lesson plan, students investigate the proper use of bar graphs and histograms to represent data. They learn the proper geometric definitions, experience...
Curated OER
Data Analysis of Ground Level Ozone
Sixth graders construct and interpret graphs from ozone data collected in Phoenix area. Can be adapted to other areas.
Curated OER
Probability Experiment Simulation: Design and Data Analysis Using a Graphing Calculator
Seventh graders simulate probability experiments. Using a graphing calculator, 7th graders design, conduct, and draw conclusions from simulations or probability experiments. Students construct frequency tables and compare the...


