Utah Education Network (UEN)
Linear Relationships: Tables, Equations, and Graphs
Pupils explore the concept of linear relationships. They discuss real-world examples of independent and dependent relationships. In addition, they use tables, graphs, and equations to represent linear relationships. They also use ordered...
Curated OER
DATA ANALYSIS OF GROUND LEVEL OZONE
Sixth graders construct and interpret graphs from ozone data collected in the Phoenix area.
Curated OER
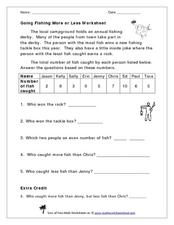
Going Fishing More or Less Worksheet
Take your class on a hypothetical fishing trip! This word problem gives a data set describing how many fish each of the nine contestants in a fishing derby caught. The numbers range from zero to ten. Learners examine the data and answer...
Curated OER
What Color Are Your Eyes?
In this color of eyes activity, students conduct a survey to determine the number of students who have brown, hazel, blue or green eyes. The information is collected and then the data is organized. Students may use the data to create...
Curated OER
Graphing Groundhog Predictions
Students create a bulletin board graph illustrating Punxsutawney Phil's past predictions. Students also perform research about past predictions. The learners also graph the predictions and answer questions about the data.
Curated OER
America Moves to the City (1865-1900)
Statistical data can show shifts in human populations without bias or a prescribed historical point of view. View bar graphs and charts that describe new influxes in urbanization, immigration, and suffrage by state during the turn of the...
Curated OER
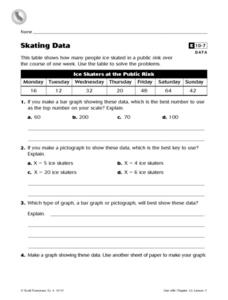
Skating Data
In this collecting data worksheet, 4th graders view a table on ice skaters at a public rink in order to answer 2 multiple choice questions, 1 short answer question and make a graph showing one piece of the data.
Curated OER
Favorite Candy Bar Graph
Students decide on six different types of candy bars to include in a data collection activity. Working in small groups, they survey a target group in a set amount of time. They access a Internet based graphing tool to create a bar graph...
Curated OER
Graphing Worksheet: Favorite Sports
In this graphing worksheet, students analyze a bar graph in which favorite sports are displayed. Students answer 8 questions about the graph. Note: The bars in the graph are shaded in different colors.
Curated OER
Types of Data
In this data chart activity, learners read the directions and study the examples to learn the difference between qualitative, quantitative, discrete and continuous data. Students answer 24 questions. This page is intended to be an online...
Curated OER
Learning to Read Graphs
In this learning to read graphs worksheet, students look at the graph showing children's favorite colors, then write how many children like each of the 4 colors.
Curated OER
Toy Sale- Writing Number Sentence and Using a Data Table Enrichment Worksheet
In this number sentence and data table enrichment worksheet, 1st graders write a number sentence using information from a data table to solve an equation in 4 examples.
Curated OER
Graph It with Coffee!
Young scholars interview employers and employees at local coffee shops about sales and profits and create graphs comparing and contrasting information obtained about the businesses.
Curated OER
Creating Circles
Learners make a circle graph. In this graphing lesson, the teacher conducts a class survey, then demonstrates how to make a pie graph. When students are comfortable with the material, they use a worksheet to create their own graph.
Curated OER
The Human Graph
Students produce a graph of favorite colors. In this graphing lesson plan, students create a human graph based on their favorite color then the teacher transfers the data to a bar graph. Students compare the lines on the graph before...
Curated OER
Leveled Problem Solving: Choosing and Analyzing Data Displays
In this using a bar graph to solve word problems worksheet, students choose and analyze data to problem solve. Students solve six problems.
Curated OER
Favorite Days of the Week
In this bar graph worksheet, students use the blank graph to survey classmates and record their favorite day of the week. Students think of one question about the graph and write it on the line.
Curated OER
Button Bonanza
Collections of data represented in stem and leaf plots are organized by young statisticians as they embark some math engaging activities.
Curated OER
Lesson #46: Bar Graphs and Line Graphs
In this bar graphs and line graphs worksheet, students interpret bar graphs, line graphs, and box-and-whisker plots. They find the measures of central tendency. This three-page worksheet contains notes, vocabulary, and approximately 10...
Noyce Foundation
Granny’s Balloon Trip
Take flight with a fun activity focused on graphing data on a coordinate plane. As learners study the data for Granny's hot-air balloon trip, including the time of day and the distance of the balloon from the ground, they practice...
PBL Pathways
Students and Teachers 2
Examine trends in student-to-teacher ratios over time. Building from the first task in the two-part series, classes now explore the pattern of student-to-teacher ratios using a non-linear function. After trying to connect the pattern to...
Teach Engineering
Linear Regression of BMD Scanners
Objects may be more linear than they appear. Scholars investigate the relationship between the number of bone mineral density scanners in the US and time. Once they take the natural logarithm of the number of scanners, a linear...
NOAA
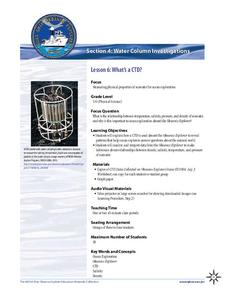
What's a CTD?
Why are the properties of the water important when exploring the ocean? Young scientists discover the tools and technology used in deep sea exploration in the fourth installment in a five-part series. Groups work together to examine...
Curated OER
Going Graph-y
Second graders listen to and dicuss the story Where the Wild Things Are. They play a pantomime game and act out various feelings so their classmates can guess. They listen for the frequency of certain words, and record their findings on...


