Curated OER
Data Analysis: bird habitats in rice farms
Fifth graders make a graph and write an essay to interpret the data of birds that take advantage of habitats near rice farms. In this data lesson plan, 5th graders calculate the information given to them and interpret it in an essay form.
Curated OER
How Many Brothers And Sisters Do You Have? -- Class Bar Graph
In this math worksheet, students collaborate in generating a class bar graph which displays information about how many brothers and sisters each classmate has. Data is plotted on a bar graph.
Curated OER
Analyzing Country Data
Pupils analyze different data in percentage form. In this statistics lesson, students plot data using box-plots, dotplot, and histogram. They compare and contrast the collected data using the boxplot.
Curated OER
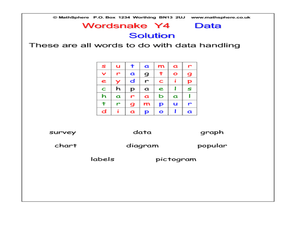
Word Snake: Data
In this data learning exercise, students search for words in a word snake, which works like a maze, for words that represent data. Students search for 8 words.
Curated OER
Box and Whiskers
Middle schoolers discover how to relate collected data with a box and whiskers graph in a number of formats. They collect, organize, create, and interpret a box and whiskers graph. Pupils interpret the difference between sets of data,...
Curated OER
The Way to Better Grades!
Pupils collect and analyze data. In this statistics lesson, learners create a scatter plot from their collected data. They use, tables and graphs to analyze the data and mae decisions.
Curated OER
First Grade Shoe Sizes
Third graders collect shoe size data from classmates in their room and another third grade. They predict what the most common shoe size will be. They place the data in an spreadsheet on the computer. They design a graph using the...
Curated OER
WHAT IS THE POPULAR COLOR?
Fourth graders graph cars according to their colors. They complete the graph including a title, scale, x-axis, and y-axis. Students collect the data and choose the type of graph to be made.
Curated OER
Graphing the Facts
Students investigate the correlation between our planet's weather and solar activity. They analyze and discuss data regarding the solar activity cycle, graph annual precipitation and temperature averages over a period of 100 years, and...
Curated OER
Favorite Apple Graph
First graders record their favorite type of apple in the form of a graph. They each try one slice of a Red Delicious, Golden Delicious, and Granny Smith apple, select their favorite type, and create a class graph using the data collected.
Curated OER
Boomerang
Students explore the concept of boomerangs. For this boomerang lesson, students throw homemade boomerangs at different angles to record maximum distance and if it returned or not. Students collect their boomerang data then create a...
Curated OER
Graphing the Population Explosion of Weeds
Students are introduced to the seed cycle and draw the specific steps. In groups, they identify the human barriers to the spreading of weeds. After calculating the rate of spreading of the Yellowstar Thistle, they create graphs to see a...
Curated OER
Which Amusement Park Would You Choose?
Students analyze data related to amusement parks and create a spreadsheet to display the data. They read the data and predict which amusement park they think is safer, create a spreadsheet and graph, and write a proposal based on their...
Curated OER
Looking for More Clues
Fifth graders explore how to collect data and display it on a bar and circle graph.
Curated OER
Favorite Days
Students collect and organize data about themselves. In this data analysis lesson, students discuss their favorite calendar dates and explore ways to display the data.
Curated OER
Eat Your Veggies
Students investigate displaying data. In this displaying data lesson, students use tallies to count data about food preferences. Students use various types of graphs such as bar graphs, picture graphs, box-and-whisker plots, etc to...
Curated OER
What's My Pattern?
Students recognize, describe and extend patterns in three activities. They organize data, find patterns and describe the rule for the pattern as well as use the graphing calculator to graph the data to make and test predictions. In the...
Curated OER
Charts and Graphs
Fifth graders interpret data into graphs and percentages. In this organizing data lesson, 5th graders discuss bar, circle and line graphs. Students complete bar graph and apply probability using the results.
Curated OER
If Our Class Went to See the Prince
First graders read the story One Monday Morning and create picture graphs based on the number of teachers, boys, and girls that would visit the prince. In this data lesson plan, 1st graders interpret tables and graphs with the help of...
Curated OER
Reading the Neighborhood
First graders complete activities with the story One Monday Morning in the Macmillan/McGraw Hill Textbook. In this data lesson, 1st graders read the story and gather data to create a picture graph. They read the graph and answer...
Curated OER
Making and Interpreting Tables
In this data tables worksheet, students make and interpret data tables given data about magazine sales. They categorize their data, complete their data table and answer questions about their data.
Curated OER
Religious Book Sales Climb
In this analyzing data worksheet, students review a graph from the USA Today. Students study the graph and answer four questions about the graph. There are also two extension questions included.
Curated OER
The Numbers Tell the Story
Students demonstrate how to gather and interpret statistical data. In this data analysis lesson, students search for statistics on the health effects of smoking and place the information into charts. Students create these charts online...
Curated OER
When is Your Birthday?
Students use data about their birthdays to create graphs. In this collecting and communicating information lesson, students make a class list of their birthdays. Students use the information to make a bar graph showing the information.


