Curated OER
Analysis of the Concentration of Sodium Chloride in a Product
Students design an experiment to test for the concentration of chloride in products. In this analysis of chloride concentration lesson plan, students develop and conduct an experiment to find the amount of chloride ion in a substance of...
Curated OER
Class Birthday Graph
Students analyze the basics of an Excel spreadsheet. They highlight cells in a spreadsheet. They make a column graph. Students are introduced to X-axis and Y-axis. They play various address games on the spreadsheet.
Curated OER
Graphing in an Experimental Context
Seventh graders discuss the importance of being able to represent scientific data in the form of graphs. They comprehend the differences between a bar graph and a line graph. Students identify the type of data with which each graph...
Curated OER
Walking on Air
Pupils collect and analyze data with a graph. In this statistics instructional activity, students use central tendencies to find the meaning of their data. They display the data on a Ti calculator.
Curated OER
Mystery Graphs
Pupils study graphs and learn how to display information into a graph. In this graph lesson plan, students construct a graph of their own sorted data, and pick out things in graphs that are inconsistent.
Curated OER
How do We Treat Our Environment?
Seventh graders explore the concept of collecting data. In this data collection instructional activity, 7th graders survey others about their environmental habits. Students graph their data.
Curated OER
ou are the Researcher!
Students conduct a census at school. They collect data, tally it, and create a frequency table. Students display their data in three different types of graphs. They write complete sentences describing the graph.
Curated OER
My Peanut Butter is Better Than Yours!
Students explore the concept of statistical data. In this statistical data lesson, students read an article about the dangers of peanut butter to those who are allergic. Students perform a taste test of two different brands of peanut...
Curated OER
NCAA Basketball finals
Young scholars read and interpret graphs of data sets. The data is used to devise reasons as to why teams in the NCAA Basketball finals from the 1950'sand up have the highest scores.
Curated OER
Circles Minilab
Young scholars learn how to measure the diameter and circumference of a circle. For this circle lesson, students organize their data to create a graph. Young scholars utilize their graph to make an inference about the slope of pi.
Curated OER
Statistical Pictures of School and Life
Students explore how mathematical data is used to summarize and illustrate everyday life. They apply mathematical concepts and skills to analyze data. Students conduct a five question survey of 50 people or more and graph the data.
Curated OER
Our Favorites
Students participate in and conduct a survey to determine various class favorites. They collect, organize and display their data, interpret the results, and complete a packet of worksheets to display the information.
Curated OER
Stemmin'-n-Leafin'
Learners make stem and leaf charts to determine the measures of central tendency using test score data. They analyze the data to draw inferences which they share with the class. They complete the associated worksheets.
Curated OER
Candy Colors: Figuring the Mean, Median, and Mode
Students count candy by color and then calculate mean, median, and mode. They count candy and use the data to calculate mean, median, and mode (by color) and apply their learning to another collection of data.
Curated OER
Information at a Glance - Using Tables in Mathematics
Young scholars create table to display GED Testing data located in paragraph provided by teacher, use information in table to create appropriate graph, and determine percentage difference between passing scores and failing scores.
Curated OER
Dough Lake Topology
Students practice coordinates and measurements, develop 2D, 3D topological map, construct grid with string on real surface, establish "level" fixed point for measurements, take and record data points of elevation, and enter data on...
Curated OER
Bias in Statistics
Students work to develop surveys and collect data. They display the data using circle graphs, histograms, box and whisker plots, and scatter plots. Students use multimedia tools to develop a visual presentation to display their data.
Curated OER
Canada's Climate: Temperature and Rainfall Variations
Students analyze data about various climates in Canada. In this data analysis and climate lesson, students use Canada Year Book 1999 to complete a worksheet and make connections between precipitation and temperature in different climates.
Curated OER
Bats and Hot Dogs
Students identify patterns and relationships from data that is collected and solve variables. In this investigative lesson students study ocean productivity, the nitrogen cycle and phytoplankton then answer questions.
Curated OER
Mapping River Statistics
Students research different statistics to do with the Mississippi River. They answer questions about finding data and collect it by conducting research. The research is used to construct a data table. Then students use the table to...
Curated OER
Discovering Pi
Students develop a formula that describes the functional relationship of the circumference of a circle to its diameter. Working with a partner, they measure the diameter and circumference of circular objects in order to discover the...
Curated OER
How High Are the Clouds?
Learners analyze height and collect data to create a graph. In this statistics lesson, students use central tendencies to analyze their data and make predictions. They apply concept of statistics to other areas of academics to make a...
Curated OER
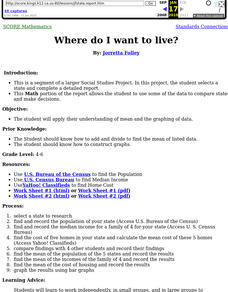
Where Do I Want To Live?
Students use a variety of Internet sources to gather income, population and housing data. Each group bring their results to the class and the class use their findings to compile mean population, income, and housing for all states.
Curated OER
Local Traffic Survey
Young scholars conduct a traffic survey and interpret their data and use graphs and charts to display their results.


