Council for Economic Education
The Economics of Income: If You’re So Smart, Why Aren't You Rich?
If basketball players make more than teachers, why shouldn't learners all aspire to play in the NBA? Unraveling the cost and benefits of education and future economic success can be tricky. Economic data, real-life cases, and some...
Curated OER
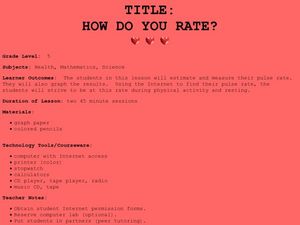
How Do You Rate?
Fifth graders make a graph. In this pulse rate lesson, 5th graders estimate their pulse and record it. Students measure their pulse while at rest and after physical activity and record it. Students use the internet to graph their results...
Curated OER
Arthropod Data Collection
Students describe the life cycle of various bugs as well as their predators and feeding habits. The class participates in a discussion of the various methods scientists use to gather data including research and experiment. After...
Curated OER
Weather "Whys"
Students complete activities to explore fall weather. In this weather lesson, students use the given links to examine weather forecasts. Students complete a weather graph activity and watch Internet field trips. Students complete fall...
Curated OER
"The Outsiders" by S.E. Hinton
Middle schoolers estimate the distance in miles between Tulsa, Oklahoma and Manhattan, Kansas. They gather and graph data on gangs in both areas.
Curated OER
IT IS ABOUT SUPPLY AND DEMAND.
Students learn that the price of an item is defined by its supply and demand. In this lesson students graph the relationship between demand and supply of various products, students also consider hidden costs.
Curated OER
Using Graphs and Charts
Students complete T charts and manipulate numbers using graphs and charts. In this math graphs and charts instructional activity, students review the concepts of pattern and function. Students then complete practice pages where they...
Curated OER
Graphing Data on Ellis Island
Third graders use data to make a bar graph. In this graphing and social studies lesson, 3rd graders use data about where Ellis Island immigrants came from to complete a bar graph on Microsoft Excel.
Curated OER
Graphing Practice
Students study the ways to graph values. In this graphing lesson plan students read graphs and use a rubric to decide how well each is constructed
Curated OER
GRAPH-A-TROSS
Students graph many sets of data from the Albatross Project including, flight distances, flight destinations, time between feedings, weight gain of the baby albatross, hatching and fledging dates
Curated OER
Zebra Mussel Population Simulation
Students are taught how to format and enter data into an Excel spreadsheet. They make a graph, and interpret graphed data. Students discuss the possible impacts of zebra mussels on the Hudson river. They graph zebra mussel data.
Curated OER
Exploring Muscle Action in the Human Body
Students collect and graph data and use the internet to research the skeletal muscles.
Curated OER
Have You Looked Outside? Lesson #5- Graphing Weather Conditions
First graders study daily weather changes. In this weather and graphing activity, 1st graders chart the daily weather for a month using stickers or weather symbols. They graph the weekly weather so that at the end of the month students...
Curated OER
And the Survey Says...
Create a survey and graph! In this graphing lesson, learners listen to a story about pets, create a survey for family and friends about what pets they own, and use the information to create a bar and line graph.
Curated OER
Bugs, Bugs, Everywhere!
Students collect and compare bugs using magnifying lenses and graph data based on their comparisons. In this bugs lesson plan, students also make an aspirator by using a jar, tubing, and screen.
National Wildlife Federation
I’ve Got the POWER! Solar Energy Potential at Your School
Should every school have solar panels? The 19th lesson in a series of 21 has scholars research the feasibility of using solar panels at their school. They begin by gathering data on the solar energy in the area before estimating the...
Curated OER
Checking Test Comparability/Scattergrams
Students construct a scattergram graph. In this statistics lesson, students graph data by hand and using a spreadsheet program. They establish lines of best fit and draw conclusions using their graphs.
Curated OER
Thanksgiving Dinner
Students plan a traditional Thanksgiving dinner. In this Thanksgiving lesson, students compare and contrast the first Thanksgiving to Thanksgiving celebrations today. Students plan a traditional Thanksgiving dinner and research the costs...
Curated OER
Decisions, Decisions, Decisions
Students examine graphs to find the most appropriate for various kinds of data. In this graphing instructional activity, student create bar, line and circle graphs. Students create graphs electronically and manually interpreting the data.
Curated OER
Math Lesson: What Do You Want to Know? - Country Statistics
Students are able to identify the characteristics of a variety of graphs (i.e. bar graph, line graph, pie graph, scatter plot, population pyramids, etc.) They recognize how the type of data to be presented plays a role in choosing the...
Curated OER
Gummy Bear Math
First graders predict, collect data, and create a graph based on gummy bear colors they are given. In this graphing lesson plan, 1st graders first predict how many colors of gummy bears there are. They then count the colors, graph them,...
Curated OER
Bunny Cakes and Graphing
Third graders graph and analyze data relating to the book "Bunny Cakes" by Rosemary Wells. They listen to and discuss the book, vote on their favorite cake using Excel computer software, and discuss the results.
Curated OER
Then and Now
Learners conduct research and use census data to compare different times and places. In this census lesson, students interpret data from charts and graphs, comparing census information from two time periods as well as from two different...
Curated OER
Counting Candies
Learners count, sort, and classify jellybeans by color. They use their data to create a bar graph. Students are given a small bag of jellybeans, and a worksheet on Counting Candies Tally Chart. They work in small groups. Learners are...


