Curated OER
Mean, Median, and Mode
Fourth graders compare two sets of data by using a double bar graph. For this data analysis lesson, 4th graders study a double bar graph and complete questions based upon the data. Students construct a table to show the data from the...
Curated OER
Students Analyze Data With Scatter Plots
Scatter plot lessons can help students create different types of graphs by hand or with the aid of technology.
Curated OER
Bar Graphs and Pie Charts
Students graph data they collected and analyze it using a bar graph. In this algebra activity, students analyze their data using pie charts and bar graphs while explaining the meaning to each other. They compare and contrast bar...
Curated OER
Calculator-Based Lessons Help Examine Real-World Data
Students may determine equations based on graphs and regression models.
Curated OER
Freshman Project-Part 5
In this project instructional activity, 9th graders display their data, the make a graph and they answer analysis and conclusion questions on their experimental design project. They discuss the variables of their experiment, their major...
Curated OER
Cricket Weather
In this collecting data worksheet, 4th graders use the data collected on crickets chirps and the temperature to make a line graph by following 4 directives.
Curated OER
The constitution and Our Republic
Students record and interpret data. In this constitution activity, students discuss voting and making bar graphs. Students practice voting and do a bar graph activity. Students make visual representations of votes on the board.
Curated OER
Science Survey
In this science survey worksheet, students think of a survey question to give to their classmates, create a data table to record responses, and then graph the results to their question. This worksheet has 4 fill in the blank questions...
Curated OER
All That Corn
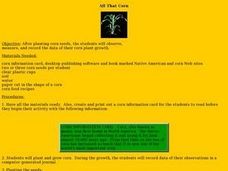
Students observe and record data. In this plant growth lesson, students plant and grow corn. Students observe the growth of their corn and record their data. Students read corn recipes and select their favorite four recipes to write...
Curated OER
More Density Graph Questions
In this density graph learning exercise, students graph data displayed in a chart. Students also calculate the density of each metal shown in the graph. Students answer questions about which detail is more dense.
Curated OER
Practice Dividing by 2, 5, or 10
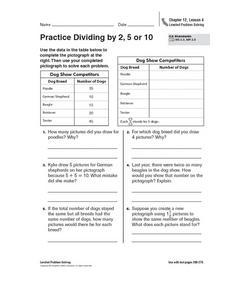
In this pictograph problem solving worksheet, students analyze the data on a table and create a pictograph. Students read and solve 6 story problems about the pictograph.
Curated OER
Data Analysis
In this data analysis worksheet, pupils solve and complete 4 different types of problems. First, they reduce the data provided to find the means, and graph the means in a line graph. Then, students graph the data from each mixture shown...
Curated OER
Point Graphs
Students experiment with point graphs. In this math lesson, students are divided into groups and perform an experiment to see how high a ball bounces, recording their results on a point graph. Students then answer provided questions.
Curated OER
Price of Apples- Linear Data
Young scholars collect data and create a graph. In this algebra lesson, students describe functions graphically, algebraically and verbally. They identify functions as being independent and dependent using variables.
Curated OER
Data Handling
In this data handling instructional activity, learners explore multiple ways to represent data. They create stem and leaf plots, histograms, and bar charts. Students examine and interpret diagrams and statistics. This eleven-page...
Curated OER
A Data Processing Lesson for Statistics -- Reading a Table or Chart
Students identify the structure and key parts of tables and charts. They determine which data is meanjngful and make comparisons with the data. They describe the scope of the AIDS plague throughout the world.


