Curated OER
The Human Graph
Students produce a graph of favorite colors. In this graphing lesson plan, students create a human graph based on their favorite color then the teacher transfers the data to a bar graph. Students compare the lines on the graph before...
Curated OER
How Do You Like To Eat Your Apples?-- Class Bar Graph
In this math worksheet, students collaborate as a group to plot data pertaining to their favorite ways to eat apples: sliced, pie, whole, sauce, caramel or muffin. Students record their class data on the bar graph.
Curated OER
Data Analysis of Ground Level Ozone
Sixth graders construct and interpret graphs from ozone data collected in Phoenix area. Can be adapted to other areas.
Curated OER
Probability Experiment Simulation: Design and Data Analysis Using a Graphing Calculator
Seventh graders simulate probability experiments. Using a graphing calculator, 7th graders design, conduct, and draw conclusions from simulations or probability experiments. Students construct frequency tables and compare the...
Curated OER
Aerosol Lesson: Science - Graphing SAGE II Data
Students examine and plot atmospheric data on bar graphs.
Utah Education Network (UEN)
Linear Relationships: Tables, Equations, and Graphs
Pupils explore the concept of linear relationships. They discuss real-world examples of independent and dependent relationships. In addition, they use tables, graphs, and equations to represent linear relationships. They also use ordered...
Curated OER
DATA ANALYSIS OF GROUND LEVEL OZONE
Sixth graders construct and interpret graphs from ozone data collected in the Phoenix area.
Curated OER
Learning to Read Graphs
What is your favorite pet? This is a great tool for youngsters just learning how to read and interpret graphs. There are four simple questions. Consider extending this activity by creating a class bar graph: how many learners have a dog,...
Curated OER
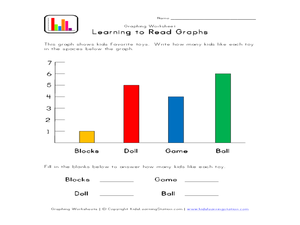
Learning to Read Graphs 2
Do you like playing with blocks, dolls, games, or balls? Use this basic graph to review bar graphs with young learners. After completing the four questions below, consider creating your own class graph: who likes blocks the best? Who...
Curated OER
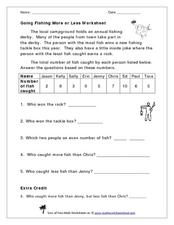
Going Fishing More or Less Worksheet
Take your class on a hypothetical fishing trip! This word problem gives a data set describing how many fish each of the nine contestants in a fishing derby caught. The numbers range from zero to ten. Learners examine the data and answer...
Curated OER
What Color Are Your Eyes?
In this color of eyes activity, students conduct a survey to determine the number of students who have brown, hazel, blue or green eyes. The information is collected and then the data is organized. Students may use the data to create...
Curated OER
Graphing Groundhog Predictions
Students create a bulletin board graph illustrating Punxsutawney Phil's past predictions. Students also perform research about past predictions. The learners also graph the predictions and answer questions about the data.
Curated OER
America Moves to the City (1865-1900)
Statistical data can show shifts in human populations without bias or a prescribed historical point of view. View bar graphs and charts that describe new influxes in urbanization, immigration, and suffrage by state during the turn of the...
Curated OER
Learn How to Graph
Students examine various types of charts and discover how to construct a line graph. Using graph paper, they construct a graph displaying weight loss over a five-year period. They draw copnclusions from the completed graphs.
Curated OER
Data Handling
In this data handling worksheet, 6th graders solve and complete 4 various types of problems. First, they draw a bar chart to represent the information provided in the table shown. Then, students show beneath the table how to work out the...
Curated OER
Using Data
In this analyzing data worksheet, 4th graders read, study and interpret a bar graph on how many hours Millie spends a week drawing each day. Students answer 2 short answer questions relating to the bar graph.
Curated OER
Types of Data
In this data chart activity, learners read the directions and study the examples to learn the difference between qualitative, quantitative, discrete and continuous data. Students answer 24 questions. This page is intended to be an online...
Curated OER
Toy Sale- Writing Number Sentence and Using a Data Table Enrichment Worksheet
In this number sentence and data table enrichment worksheet, 1st graders write a number sentence using information from a data table to solve an equation in 4 examples.
Curated OER
Great Graphing
Students collect data, use a computer spreadsheet program to create various graphs, and compare the graphs. They state the findings of each graph in writing and decide which graph type best represents the data.
Curated OER
Build A Skittles Graph
Students explore graphing. In this graphing lesson, students sort Skittles candies and use the color groups to create a bar graph. Rubrics and extension activities are provided.
Curated OER
Applied Science - Science and Math Lab
Students make a prediction. In this applied science instructional activity, students guess the number of items in a jar. Students create a bar graph to show the predictions and the actual amounts.
Curated OER
Leveled Problem Solving: Choosing and Analyzing Data Displays
In this using a bar graph to solve word problems worksheet, students choose and analyze data to problem solve. Students solve six problems.
Curated OER
Make a Graph
In this graphing learning exercise, 1st graders use given data to create a graph and answer questions. In this problem solving learning exercise, students solve five problems.
Curated OER
Button Bonanza
Collections of data represented in stem and leaf plots are organized by young statisticians as they embark some math engaging activities.
Other popular searches
- Data Analysis and Graphs
- Data and Graphs
- Data Collection and Graphs
- Data Graphs
- Analyzing Data and Graphs
- Analyzing Data in Graphs
- Data Interpretation Graphs
- Data Sets and Graphs
- Graphs and Data Display
- Graphs and Data Tables
- Create Data Tables From Graphs
- Analyze Data and Graphs


