Curated OER
Diagnosing Allergies Through Data Collection
Students research and organize information about allergies. In this data collection lesson, students watch a video about allergies. Students create a histogram using the information collected. Students complete the 'Displaying Survey...
Curated OER
Significant Science: Statistics for Planet Earth
Ninth graders discover how statistics are used to interpret results of scientific experiments. Students write hypotheses and test the hypotheses by collecting data and organizing the data. Students graph their data to produce a visual....
Curated OER
Functions As Graphs Worksheet
For this math worksheet, students graph the data given in the organizer. The functions are used to create the new line for finding the possible unknowns.
Curated OER
Graphs and Transformations of Functions
Is it possible to solve quadratic equations by factoring? It is, and your class will graph quadratic equation and functions too. They perform transformation on their graphs showing increasing and decreasing intervals, domain, and range....
Curated OER
Usage and Interpretation of Graphs
Cooperative groups are formed for this graphing activity. Each group must construct a graph that represents how many eyelets (the holes for laces in shoes), are present in their group. A whole-class bar graph is eventually constructed...
Curated OER
Graphing
Intended for a faith-based classroom, this instructional activity requires second graders to create a survey, conduct the survey in multiple classrooms, and graph the results. They can choose between creating a picture or bar graph, or...
Curated OER
Graphs and Functions
Use this series of activities to introduce learners to graphing functions. They graph both linear and quadratic equations by hand and with a Graph Sketcher Tool. Several imbedded links and handouts are included in the lesson.
Curated OER
Graphing Names in Historic Cemetery
Students collect information from headstones about names of the deceased in their local community. They determine the most common names and graph them. They discuss their findings with the class.
Curated OER
Kindergarten Class Favorites
Students discuss their favorite foods, a list of four favorite food are compiled on the board or a chart. They each vote for their favorite food and the data is entered onto a spread sheet and a graph is created while the students watch...
Curated OER
Return Intervals & Reasoning from Tabular Data
Learners calculate derivatives from a set of data. For this calculus lesson, students estimate the limit at infinity. They complete a Return Interval handout at the end of the lesson.
Curated OER
Best-Selling Books Bar Graph
Create a bar graph with your elementary school learners. First they read and interpret data, and then they color in the graph (provided) to indicate how many of each were sold. Consider providing them with the data but having them...
Curated OER
Let's Get Linear
Math whizzes utilize spreadsheets to examine linear modeling. They roll marbles down a ramp from three different heights and measure how far they roll. They use Excel to record their data and create a plot of their data.
Curated OER
To Recycle, or Not Recycle?
To recycle or not to recycle, that is the question. Your class can find the answer by taking a teacher created WebQuest, where they assume a role of a community member taking a stand on implementing a community wide recycling plan. The...
Cornell University
Energy Changes in Chemical Reactions
The heat of solution measures how much thermal energy a dissolving substance consumes or gives off. The experiment demonstrates both endothermic and exothermic reactions. Scholars dissolve several substances, measure the temperature...
Curated OER
ou are the Researcher!
Students conduct a census at school. They collect data, tally it, and create a frequency table. Students display their data in three different types of graphs. They write complete sentences describing the graph.
Curated OER
Patterns, Relations, and Functions
Students investigate the patterns of different data sets of numbers. They use critical thinking skills in order to find the missing numbers in any given set. This lesson helps to develop the skill of number sense.
Curated OER
EXCEL It!
Students surf the Web gathering information about graphs. The data collected is incorporated into an Excel spreadsheet and graphs of varying nature generated to further enhance student understanding.
Curated OER
Creating a Graph
Learners brainstorm favorite things to do during the summer. They survey classmates to collect data, arrange it in a chart, and create graphs using ClarisWorks.
Chicago Botanic Garden
Historical Climate Cycles
Scientists use ice core samples to obtain temperatures of the earth from 400,000 years ago! The third of five lessons instructs pupils to interpret historical climate data to see changes over time. In part I, participants interpret...
American Statistical Association
Step into Statastics
Class members study the size of classmates' feet and perform a statistical analysis of their data. They solve for central tendencies, quartiles, and spread for the entire group as well as subgroups. They then write a conclusion based on...
Curated OER
How Many Frogs?
Students explore the concept of linear regression. In this linear regression instructional activity, students find the line of best fit for a set of data pertaining to a frog population. Students use their line of best fit to predict the...
NOAA
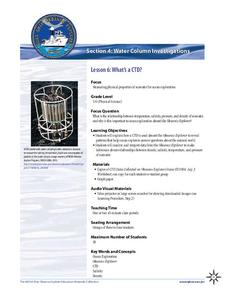
What's a CTD?
Why are the properties of the water important when exploring the ocean? Young scientists discover the tools and technology used in deep sea exploration in the fourth installment in a five-part series. Groups work together to...
Alabama Learning Exchange
Yummy Apples!
Young learners listen to a read aloud of Gail Gibbons book, Apples and the story A Red House With No Windows and No Doors. They compare characteristics of a number of kinds of apples, graph them and create a apple print picture. Learners...
Curated OER
Exploring Careers
The world is full of possibilities for your ELLs. Help them explore their career options with a lesson that incorporates Internet research and expository writing. Not only will they learn more about their careers of choice, but both...
Other popular searches
- Data Analysis and Graphs
- Data and Graphs
- Data Collection and Graphs
- Data Graphs
- Analyzing Data and Graphs
- Analyzing Data in Graphs
- Data Interpretation Graphs
- Data Sets and Graphs
- Graphs and Data Display
- Graphs and Data Tables
- Create Data Tables From Graphs
- Analyze Data and Graphs


