Curated OER
Representing Data
Young scholars use their math skills to solve real-world situations. In groups, they must work with data and organize it in a chart for use to make different graphs. Individually, they complete different activities and share their...
Curated OER
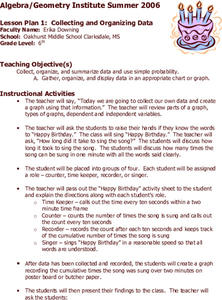
Collecting and Organizing Data
Sixth graders practice collecting and organizing data. In groups, 6th graders determine how many times "Happy Birthday" (at a reasonable rate) may be sung in ten seconds. They collect the information and create a graph.
Curated OER
Finding Equations
Students make equations from everyday data. They create a graph from the equations. Students predict and analyze the results. Students complete the second scenario on their own and turn in their handout.
Curated OER
Graph Lesson
First graders collect data on different eye colors of each student in their classroom. They input the data that they gathered in an Excel spreadsheet and then create a graph in Excel.
Illustrative Mathematics
Bike Race
A graph not only tells us who won the bike race, but also what happened during the race. Use this resource to help learners understand graphs. The commentary suggests waiting until the end of the year to introduce this topic, but why...
Curated OER
Mean, Median, and Mode
Fourth graders compare two sets of data by using a double bar graph. In this data analysis activity, 4th graders study a double bar graph and complete questions based upon the data. Students construct a table to show the data from the...
Curated OER
Bar Graphs
Students perform operations and graph their data using charts and bar graphs. In this algebra lesson plan, students follow specific steps to make a bar graph. They create a survey about people favorite things and plot their data...
Curated OER
The constitution and Our Republic
Learners record and interpret data. For this constitution lesson, students discuss voting and making bar graphs. Learners practice voting and do a bar graph activity. Students make visual representations of votes on the board.
Curated OER
Beginning Graphs in MS Excel
Students practice creating graphs in Microsoft Excel. For this technology lesson, students conduct a random survey and collect data. Students use the Microsoft Excel program to create a bar graph of the data.
Curated OER
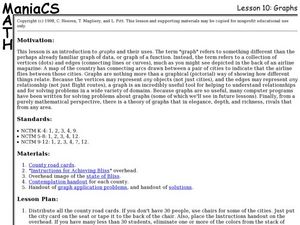
Lesson 10: Graphs
Learners explore graph theory. In this geometry lesson, graphs are used to solve problems in a variety of domains. In this lesson the term graph refers to a collection of vertices and edges used to depict...
Curated OER
Beginning Modeling for Linear and Quadratic Data
Students create models to represent both linear and quadratic equations. In this algebra instructional activity, students collect data from the real world and analyze it. They graph and differentiate between the two types.
Curated OER
Price of Apples- Linear Data
Young scholars collect data and create a graph. In this algebra lesson, students describe functions graphically, algebraically and verbally. They identify functions as being independent and dependent using variables.
Curated OER
A Data Processing Lesson for Statistics -- Reading a Table or Chart
Students identify the structure and key parts of tables and charts. They determine which data is meanjngful and make comparisons with the data. They describe the scope of the AIDS plague throughout the world.
Curated OER
Data Analysis
Students double check their data collections of Top 20 singles that they've been collecting for several days. Types of data is reviewed in detail and a variety of questions are asked for retention factors of mastery. They draw a tally...
Curated OER
Skittle Graphing (Lesson Plan)
Pupils discuss the uses of graphs. They use color candies to count and sort before designing graphs. They label the graph papers with appropriate titles and candy colors. They complete the graph bars, and discuss the results with a...
Curated OER
Data Days
Sixth graders practice collecting, organizing and displaying data. They create circle, bar, line and picto graphs. They analyze data in small and large sample groups.
Curated OER
Rouge River Data
Students participate in using Excel sofware in order to create graphs. They create the graphs using data that they gathered during the Rouge River Field Trip they attended. The produce bar graphs from the excel spreadsheets.
Curated OER
Survey Says...
Young learners create and implement a school-wide survey about student body favorites! Learners record and analyze the data on a bar graph, picture graph, and line graph, and then display the data. Then, wrap it all up with a celebration...
Curated OER
Counting
First graders explore collecting data. They collect data using a data collection sheet and enter the data into Excel. Students create graphs using Excel. They share their graphs with the class.
Curated OER
Rainbows, Bridges & Weather, Oh My!
Explore how real-world applications can be parabolic in nature and how to find quadratic functions that best fit data. A number of different examples of modeling parabolas are explored including a student scavenger hunt, the exploration...
Curated OER
Statistics of Mars
Students explore the concept of central tendencies. In this central tendencies lesson, students sort M&M's or Skittles based on color. Students graph their results. Students find the mean, median, and mode of their data.
Curated OER
El Nino Lesson
Students compare graphs of weather occurrences. In this environmental lesson plan, students will being using the website to gather weather related information for a certain time period. The students will then graph the data that will be...
Curated OER
Surname Survey
Students use data from the U.S. Census Bureau to determine whether last names in a local phone directory reflect the Census Bureau's list of the most common surnames in the country. In this surnames lesson plan, students use the Internet...
Curated OER
Favorite Food
Students are given three choices of food. They then decide on their favorite and predict what the class's favorite food will be. After the teacher enters the data into the computer, students gather around the computer to view the...
Other popular searches
- Data Analysis and Graphs
- Data and Graphs
- Data Collection and Graphs
- Data Graphs
- Analyzing Data and Graphs
- Analyzing Data in Graphs
- Data Interpretation Graphs
- Data Sets and Graphs
- Graphs and Data Display
- Graphs and Data Tables
- Create Data Tables From Graphs
- Analyze Data and Graphs


