Curated OER
Rouge River Data
Students participate in using Excel sofware in order to create graphs. They create the graphs using data that they gathered during the Rouge River Field Trip they attended. The produce bar graphs from the excel spreadsheets.
Curated OER
Survey Says...
Young learners create and implement a school-wide survey about student body favorites! Learners record and analyze the data on a bar graph, picture graph, and line graph, and then display the data. Then, wrap it all up with a celebration...
Curated OER
Counting
First graders explore collecting data. They collect data using a data collection sheet and enter the data into Excel. Students create graphs using Excel. They share their graphs with the class.
Curated OER
Rainbows, Bridges & Weather, Oh My!
Explore how real-world applications can be parabolic in nature and how to find quadratic functions that best fit data. A number of different examples of modeling parabolas are explored including a student scavenger hunt, the exploration...
Curated OER
Statistics of Mars
Students explore the concept of central tendencies. In this central tendencies lesson, students sort M&M's or Skittles based on color. Students graph their results. Students find the mean, median, and mode of their data.
Curated OER
El Nino Lesson
Students compare graphs of weather occurrences. In this environmental lesson plan, students will being using the website to gather weather related information for a certain time period. The students will then graph the data that will be...
Curated OER
Surname Survey
Students use data from the U.S. Census Bureau to determine whether last names in a local phone directory reflect the Census Bureau's list of the most common surnames in the country. In this surnames lesson plan, students use the Internet...
Curated OER
Favorite Food
Students are given three choices of food. They then decide on their favorite and predict what the class's favorite food will be. After the teacher enters the data into the computer, students gather around the computer to view the...
Curated OER
Invasives and Marsh Birds
Students are taught that invasive plant removal can have a variety of impacts. They are shown this by using graphs. Students view maps of vegetation change on Iona Island. They discuss implications of changes on marsh birds using data...
Kenan Fellows
Density
Most scholars associate density with floating, but how do scientists determine the exact density of an unknown liquid? The third lesson in a seven-part series challenges scholars to find the mass and volume of two unknown liquids. Each...
Curated OER
Time That Period
Physical science starters play with a pendulum in order to experience periodicity. Detailed procedures and a worksheet are included for day one. For day two, learners will use a graphing calculator to help them plot orbit data from a...
Chicago Botanic Garden
Climate Change Around the World
Look at climate change around the world using graphical representations and a hands-on learning simulation specified to particular cities around the world. Using an interactive website, young scientists follow the provided directions to...
Teach Engineering
Android Acceleration
Prepare to accelerate your Android. Pupils prep for the upcoming activity in this third installment of a four-part series. The lesson progresses nicely by first introducing different types of acceleration to the class. The teacher...
West Contra Costa Unified School District
Writing Exponential Functions Based on Data
Give your class a concrete example of exponential growth and decay using this hands-on activity. These Algebra II lessons allow for the exploration of exponential growth and decay models, as well as the discovery of the patterns of each....
Curated OER
Inquiry Unit: Modeling Maximums and Minimums
Young mathematicians explore the maximun area for patio with the added complexity of finding the mimimum cost for construction. First, they maximize the area of a yard given a limited amount of fence and plot width v. area on a scatter...
Centers for Disease Control and Prevention
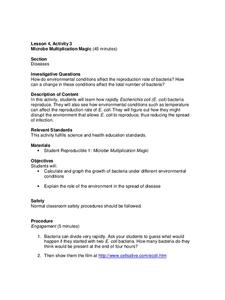
Microbe Multiplication Magic
A lesson introduces the reproduction rate of E. coli though a video. Then scholars complete a data table and graph of reproduction rates in ideal conditions as well as less than ideal conditions.
Curated OER
Missing Macroinvertebrates - Stream Side Science
Field study groups collect samples of stream water and identify the macroinvertebrates found. Using their data, they calculate a water quality index to rate the health of the stream. They graph their data and discuss the value of a water...
Towson University
It's a Gassy World!
How much does your class know about the relationship between climate change and carbon dioxide? Science scholars explore the nature of greenhouse gases and rising ocean temperature through demonstrations, research, and experiments. The...
Curated OER
Bounce With Me
How many practice lay-ups do you think Michael Jordan has done in his lifetime? Too many to count, but he had to start somewhere! Practice is the key to getting better in any activity. Look through this basketball lesson as there are...
Curated OER
Matrix Madness!!
Perform operations to add, subtract, multiply and divide matrices. Then solve problems with vectors using matrices. A three day activity: Matrix Madness, Mystical Matrices, and Decode the Encode. The last activity has prizes that the...
Virginia Department of Education
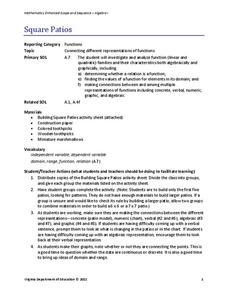
Square Patios
Build a patio from toothpicks and marshmallows to analyze functions! Learners look for patterns in the data as they create different size patios. As they discover patterns, they make connections between the different representations of...
EngageNY
Piecewise and Step Functions in Context
Looking for an application for step functions? This activity uses real data to examine piecewise step functions. Groups create a list of data from varying scenarios and create a model to use to make recommendations to increase revenue.
Beyond Benign
The Heat Is On
Explore an exothermic reaction with a quick lab investigation. The activity builds on the previous lessons by examining an ingredient in many shampoos. Scholars record temperature data as sodium hydroxide and water interact.
Curated OER
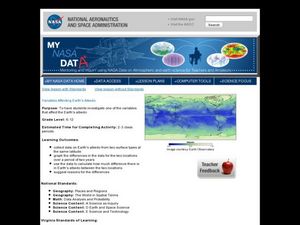
Variables Affecting Earth's Albedo
Students study the variables that affect the Earth's albedo. In this environmental data analysis lesson plan students interpret and graph information and calculate changes.
Other popular searches
- Data Analysis and Graphs
- Data and Graphs
- Data Collection and Graphs
- Data Graphs
- Analyzing Data and Graphs
- Analyzing Data in Graphs
- Data Interpretation Graphs
- Data Sets and Graphs
- Graphs and Data Display
- Graphs and Data Tables
- Create Data Tables From Graphs
- Analyze Data and Graphs


