Curated OER
Build a Bar Graph
Learners discover how to use bar graphs. They will gather and organize specific data in order to put it into a bar graph. Then they will answer several questions based on the information they have graphed.
Curated OER
Graph It!
There is more than one way to represent data! Learners explore ways to represent data. They examine stacked graphs, histograms, and line plots. They conduct surveys and use stacked graphs, histograms, or line plots to chart the data they...
Council for Economic Education
GDP Data: Is the Economy Healthy?
Does the economy needs a check-up? Scholars analyze the gross domestic product (GDP) to determine the overall health of the current economy. They use a short video clip as well as economic data to determine the current growth of the...
Curated OER
Matrix Analysis of Networks
Explore the connection between a finite graph, a directed graph, and a matrix. Graph lines and identify the relationship of matrices in real-world scenarios. Then use this information to work with a partner to plan and design a town...
Curated OER
Building Brilliant Bar Graphs
Everything you need for a mini-unit on bar graphs is included in this lesson plan! It outlines three lessons and includes worksheets. Learners taste pretzels, shoot baskets (switching off hands), and grab candy, graphing results...
Curated OER
Interpreting Data and Building Hypothesis
Students define the term species, and graph species data together with previously collected data at the National Zoo. They interpret graphed data and recognize patterns in the streamside quadrant versus hillside quadrant. Students use...
NASA
Geographical Influences
"If global warming is real, why is it so cold?" Distinguishing the difference between weather and climate is important when it comes to understanding our planet. In these activities, young scientists look at the climate patterns in a...
Curated OER
Pick A Number
Elementary schoolers find out which month has the most class birthdays (mode) and which birthday represents the middle point of all the birthdays (median). They gather and organize data to find one number that fairly represents the whole...
Georgia Department of Education
Math Class
Young analysts use real (provided) data from a class's test scores to practice using statistical tools. Not only do learners calculate measures of center and spread (including mean, median, deviation, and IQ range), but also use this...
Statistics Education Web
You Will Soon Analyze Categorical Data (Classifying Fortune Cookie Fortunes)
Would you rely on a fortune cookie for advice? The lesson first requires future statisticians to categorize 100 fortune cookie fortunes into four types: prophecy, advice, wisdom, and misc. The lesson goes on to have learners use...
Kenan Fellows
Designing and Analyzing Data Collected from Wearable Devices to Solve Problems in Health Care
Wearable devices have become more the norm than the exception. Learners analyze data from a sample device with a regression analysis in a helpful hands-on lesson. Their focus is to determine if there is a connection between temperature...
Curated OER
Representing Data
Second and third graders answer questions based on data presented to them in graphs. They see how to interpret data from a bar graph, line graph, and a chart.
Curated OER
What's Data?
Students get the opportunity to investigate the concept of data collecting. They explore how to tally and read a bar graph. Vocabulary about data is also be included. At the end of the lesson, individual students collect data independently.
Curated OER
Student Costs Data Table
Students compare and contrast two routes selected for a virtual field trip. They create a data table of educational activities, lodging, and meal costs using Microsoft Excel software.
Curated OER
What's in a Graph?
How many yellow Skittles® come in a fun-size package? Use candy color data to construct a bar graph and a pie chart. Pupils analyze bar graphs of real-life data on the Texas and Massachusetts populations. As an assessment at the end of...
American Statistical Association
Candy Judging
Determine the class favorite. The statistics lesson plan has pupils collect, display, and analyze data. Pairs rank four kinds of candy based on their individual preferences. Working as an entire class, learners determine a way to display...
Curated OER
Data and Scientific Graphs
Students conduct experiments and graph their data. In this statistics lesson, students collect data and graph it on a coordinate plane. They analyze the data looking for patterns and they discuss their findings with the class.
Curated OER
Data, Data, Everywhere... and What Am I To Think?
Students demonstrate good random sampling techniques for data collection, select and develop graphic presentations of data and analyze the data to solve a problem presented.
Curated OER
Choose The Appropriate Graph
Fifth graders work in groups to investigate the proper use of a graph during a schoolyard ecology project. The challenge of the project is for students to choose the proper form of a graph. They gather data and conduct analysis with the...
Curated OER
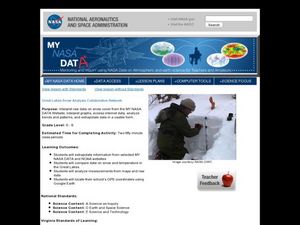
Great Lakes Snow Analysis Collaborative Network
Students interpret data on snow cover and analyze trend patterns. For this snow lesson students compare data and locate their school's GPS coordinates.
Willow Tree
Bar Graphs
Circles, lines, dots, boxes: graphs come in all shapes in sizes. Scholars learn how to make a bar graph using univariate data. They also analyze data using those bar graphs.
Curated OER
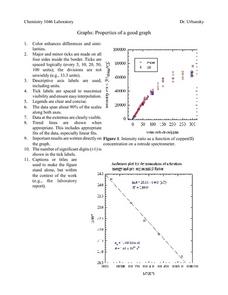
Properties of a Good Graph
For this chemistry worksheet, students examine the common characteristics of an acceptable graph that is meant to be used to display data.
Curated OER
Accidents Happen: Seat Belt Laws, Enforcement, and Usage
Start with a NOVA video about car crashes, crash test dummy footage, or other video about seat belt use. Or have groups review attached data about seat belt usage (by state) and share their conclusions. Learners then devise a method to...
Curated OER
Dot Plots
Number crunching statisticians explore displaying data with dot plots and define the difference between quantitative data and qualitative data. Dot plots are created based on a set of given data and analyzed.
Other popular searches
- Data Analysis and Graphs
- Data and Graphs
- Data Collection and Graphs
- Data Graphs
- Analyzing Data and Graphs
- Analyzing Data in Graphs
- Data Interpretation Graphs
- Data Sets and Graphs
- Graphs and Data Display
- Graphs and Data Tables
- Create Data Tables From Graphs
- Analyze Data and Graphs


