Curated OER
Investigating: Interpreting Graphs and Analyzing Data
Students explore statistics by researching class birthday data. In this data analysis lesson, students investigate the different birthdays among their classmates and create data tables based on the given information. Students view bar...
Curated OER
Looking at Data
Third graders use two days to create, collect, display and analyze data. Classroom activities and practice build greater understanding to a variety of forms used to display data.
Curated OER
Use a Graph Reteach 4.8
For this graph worksheet, students solve 3 problems using a data table and bar graph. Students write number sentences to figure out answers to the questions about kinds of toys in a shop.
Curated OER
Using Computer for Statistical Analysis
Students examine the use for spreadsheets in analyzing data. They make spreadsheets that display and calculate a given data set such as temperature change.
Curated OER
Get the Picture with Graphs
Fifth graders examine line, bar and circle graphs in the newspaper and on the Internet. They complete sketches of graphs with an emphasis on selecting the best model to depict the data collected.
Curated OER
Graphing With Paper and Computers
Fourth graders construct bar graphs. In this graphing lesson, 4th graders create bar graphs in connection with the story, The Copycat Fish. After creating the initial graphs on paper, students use MS Excel to create graphs.
Curated OER
Making a Bar Graph
In this bar graph worksheet, students analyze a data table and bar graph depicting information about stickers collected. Students answer 5 questions about the data displayed.
Curated OER
Bunny Cakes and Graphing
Third graders graph and analyze data relating to the book "Bunny Cakes" by Rosemary Wells. They listen to and discuss the book, vote on their favorite cake using Excel computer software, and discuss the results.
Curated OER
More Density Graph Questions
In this density graph learning exercise, students graph data displayed in a chart. Students also calculate the density of each metal shown in the graph. Students answer questions about which detail is more dense.
Curated OER
Graphing Predator/Prey Data
Learners use data from the Camouflage Game (played with red and green yarn caterpillars) to create a composite bar graph to display the collected data. They interpret the data and form a conclusion based on the graphs. Teachers may use...
Curated OER
A Solubility Curve for Potassium Nitrate
Step-by-step laboratory instructions are listed so that chemistry explorers can consider the solubility of potassium nitrate. They combine their results with those of other lab groups and then graph the data to display the solubility...
Curated OER
Positive Future Fair Project
Ninth graders view the film "Pay It Forward" and discuss what kind of public campaign is needed to move people to positive action. They consider different ways of presenting information (graphs, visual displays, etc.) as tools for...
Council for Economic Education
FRED and the Federal Budget Interactive Lesson
How can a federal debt accumulate over time? The Federal Reserve Economic Data (FRED) dashboard allows scholars to actively research each aspect of the federal budget. In pairs, they analyze economic data to determine the best way to...
Curated OER
Introduction to Graphs: Bar Graphs, Line Graphs, Circle Graphs
In this graphing data worksheet, students answer 5 short answer questions about graphs. Students determine which type of graph best represents various data sets.
Shodor Education Foundation
Box Plot
What information can come from a box? Learners choose a data set to display as a box plot and decide whether to include the median in the calculation of the quartiles, show the outliers, and change the scale. To finish the lesson,...
Curated OER
Favorite Candy Bar Graph
Students decide on six different types of candy bars to include in a data collection activity. Working in small groups, they survey a target group in a set amount of time. They access a Internet based graphing tool to create a bar graph...
Willow Tree
Box-and-Whisker Plots
Whiskers are not just for cats! Pupils create box-and-whisker plots from given data sets. They analyze the data using the graphs as their guide.
Curated OER
The Guise of a Graph Gumshoe
Eighth graders practice constructing bar, circle, and box-and-whisker graphs. They practice reading and interpreting data displays and explore how different displays of data can lead to different interpretations.
Shodor Education Foundation
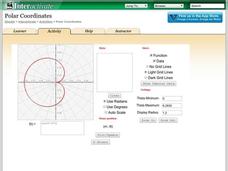
Polar Coordinates
Polar opposites might not work together—but polar coordinates do! The interactive provides learners the opportunity to graph trigonometric and algebraic functions using polar coordinates. The program takes either individual data points...
Curated OER
Mathematics and Environmental Concerns
Students gather data and analyze behaviors regarding recycling. In this environmental concerns unit, students discus and examine reuse, recycle, and reduce. Students collect, graph, and display data associated with four lessons in the...
Curated OER
Mean, Median, and Mode
Fourth graders compare two sets of data by using a double bar graph. For this data analysis lesson, 4th graders study a double bar graph and complete questions based upon the data. Students construct a table to show the data from the...
Curated OER
Freshman Project-Part 5
In this project instructional activity, 9th graders display their data, the make a graph and they answer analysis and conclusion questions on their experimental design project. They discuss the variables of their experiment, their major...
Curated OER
Holiday Tally
For this tally chart worksheet, students ask ten friends which of 3 holidays they like best. Students create a tally chart with their results and answer 6 questions.
Curated OER
Data Days
Sixth graders practice collecting, organizing and displaying data. They create circle, bar, line and picto graphs. They analyze data in small and large sample groups.


