Texas Instruments
Light and Day
Pupils explore the concept of collecting data as they collect data on their graphing calculator about time, temperature, and light. Learners plot the data and create histograms and box and whisker plots to analyze the data.
Discovery Education
Sonar & Echolocation
A well-designed, comprehensive, and attractive slide show supports direct instruction on how sonar and echolocation work. Contained within the slides are links to interactive websites and instructions for using apps on a mobile device to...
National Security Agency
It's Probably Probable
Learners make predictions and draw conclusions from given information as they learn the meaning of probability in this vocabulary-rich, integrated activity that presents a variety of teaching strategies to motivate and reach all learning...
Curated OER
Tulip Graphing
Students create a graph of tulip growth. In this data analysis lesson, students plant tulip bulbs and use graph paper to begin graphing data on the growth of the tulip.
Curated OER
Squares in the Light
Students collect and analyze data using a graph. In this algebra lesson, students explain their findings orally and with a graph. They use their knowledge to solve real life scenarios.
Curated OER
Recognizing Bias in Graphs
In this bias in graphs worksheet, students examine graphs and explain the data. They determine why the graph is or is not biased. This four-page worksheet contains approximately 6 problems. Explanations and examples are provided.
NASA
Newton Car
If a car gets heavier, it goes farther? By running an activity several times, teams experience Newton's Second Law of Motion. The teams vary the amount of weight they catapult off a wooden block car and record the distance the car...
NASA
Analyzing Surface Air Temperatures by Latitude: Student Activity
Explore global temperatures from the comfort of your learning place! Meteorologists analyze surface temperatures and anomalies across different latitudes. Investigators evaluate graphs to find temperature differences and answer questions...
Barnstable Public Schools
Math Relay Races
A plethora of activities make up a cross curricular choice page filled with math games—relay races, dice, and crossword puzzles—a survey challenge equipped with data organization, graphing, a quicksand recipe, Hula-Hoop activity to...
Curated OER
Scattered About
Students are introduced to the concept of scatter plots after reviewing the various types of graphs. In groups, they analyze the type of information one can receive from a scatter plot and identify the relationship between the x and y...
Curated OER
Displaying the Data
Students gather facts about their parent's families through the completion of parent interview forms. Using tally marks, the data gathered is counted, transferred to graphs and used to create family timelines.
Curated OER
Closing the Case
Fifth graders collect data and prepare data displays using a survey with statistical information.
Curated OER
When Dinosaurs Ruled the World
Students graph the varying sizes of dinosaurs. In this math and dinosaur lesson, students view dinosaur models and compare the different shapes and sizes of the dinosaurs. Students complete a dinosaur math activity, read The Dinosaur...
Curated OER
Graphing Using Excel
Fifth graders complete a series of graphs by gathering information and using Excel to graph the information. In this graphing lesson plan, 5th graders graph favorite desserts of the class. Student put their results into the computer and...
Curated OER
Plastic Packaging
Students collect data. In this math instructional activity, students collect data about recyclable materials. Students develop a plan that will help the environment. Recycling plastic containers is discussed.
Curated OER
Great Tasting Shapes
Fifth graders investigate the concept of median, mode, and range using a simple model for display purposes. They examine different shaped crackers out of a box and identify the ones that occur the most. Then the calculations for the...
Curated OER
Graphing Using Cookies
Pupils differentiate between bar graphs, line graphs, pictographs and bar graphs. After participating in a hands-on cookie activity, students label and draw their own graphs.
Curated OER
Candy Bar Survey
Second graders investigate the skill of graphing data by using candy bars to create context for the lesson. They use technology for graphing and organizing information like a spreadsheet. The lesson includes a resource link to aid in the...
Curated OER
Observing the Evidence
Fifth graders explore how to do research from a large group. They explore how to choose a representative sample and collect data from it.
Curated OER
Proportionality in Tables, Graphs, and Equations
Students create different methods to analyze their data. In this algebra lesson, students differentiate between proportion and non-proportional graph. They use the TI-Navigator to create the graphs and move them around to make their...
Curated OER
Graphic Favorite Breakfast Foods
Second graders graph data based on a class survey of their favorite breakfast foods. In this graphing lesson plan, 2nd graders take a class survey of their favorite breakfast foods. Then they take that data and put it into a computer...
Curated OER
Environmental Graphing
Young scholars experiment with graphing. In this graphing introduction lesson plan, students complete four activities: 1) a bar graph based on class birthdays 2) an estimation graph of the raisins in raisin bread 3) another estimation...
Curated OER
How Many Legs Does Your Pet Have?-- Class Bar Graph
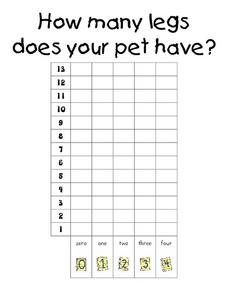
For this math worksheet, students collaborate as a class to make a bar graph displaying how many legs the students' pets have. Results are plotted on the graph.


