Curated OER
Modeling Population Growth
Learners collect data on population growth. In this statistics lesson, students graph their data and make predictions. They find the linear regression and the best fit line.
Curated OER
Polling and Statistics
Young scholars investigate polling. In this statistics lesson, students collect data-on polling and graph their data on a coordinate plane. They identify biased and non-biased polling.
Houghton Mifflin Harcourt
Unit 3 Math Vocabulary Cards (Grade 5)
Fifty-four flashcards make up a set to help reinforce math vocabulary. The set offers two types of cards; a word card printed in bold font, and a definition card equipped with an example and labels. Terms include capacity, histogram,...
Noyce Foundation
Ducklings
The class gets their mean and median all in a row with an assessment task that uses a population of ducklings to work with data displays and measures of central tendency. Pupils create a frequency chart and calculate the mean and median....
Curated OER
Matchstick Math: Using Manipulatives to Model Linear, Quadratic, and Exponential Functions
Playing with matches (unlit, of course) becomes an engaging learning experience in this fun instructional unit. Teach pupils how to apply properties of exponential functions to solve problems. They differentiate between quadratic and...
Curated OER
M&M's and the Scientific Method
Sixth graders explore the scientific method by conducting an in class experiment. For this scientific averages lesson, 6th graders discuss the concept of the scientific method, and define the different mathematical averages, mean, median...
Virginia Department of Education
Average Atomic Masses
Facilitate learning by using small objects to teach the principles of atomic mass in your science class. Pupils determine the average mass of varying beans as they perform a series of competitive experiments. They gather data and...
Ed Migliore
Linear Equations in Two Variables
This traditional textbook style unit includes vocabulary, a direct explanation section, examples, practice problems that directly line up with the explanations and examples, and a unit summary review and practice problems. Learners get...
Curated OER
Pick a Pet
Learners construct a pictograph of favorite pets. In this pets and graphing lesson plan, students discuss their favorite pet and use animal magazines to find their favorite pets and cut them out. Learners create a pictograph using the...
Curated OER
Wind
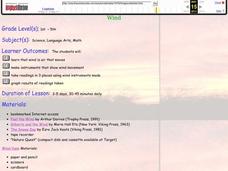
Learners make a wind vane, anemometer, wind spiral, and wind streamer to calculate wind movement. In this wind lesson plan, students test each of their wind instruments, and graph the results of the wind speed in different locations.
Curated OER
Re-Presenting Race in the Digital Age
Teen-aged scientists analyze a graphic organizer of how trash is removed from New York City and then answer standard questions about a graph and a diagram. Resources are mentioned, but there are no links to these resources, so you will...
Curated OER
Capture/Recapture
Students use proportions to estimate the size of populations. They describe the data with using a graph or table of the estimate. Students use descriptive statistics to calculate mean, median, and mode. They also compare and contrast an...
Curated OER
Hypothesis Testing
Learners investigate the finding of a hypothesis and how it can be tested.For the experiment they will be using the concept of probability. Students design an experiment and test the hypothesis. Then the results are graphed showing the...
Virginia Department of Education
Slippery Slope
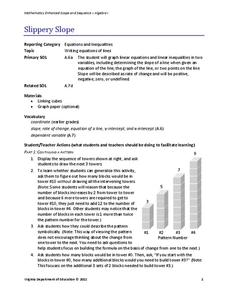
Explore slope using geometric patterns. Young mathematicians investigate towers built from cubes to develop a linear pattern. They move the data to a coordinate plane to connect the pattern to slopes.
Curated OER
Graphing Current Drug Data
Students increase understanding of the drug issue and further develop skill in graphing.
Curated OER
Surveys
Students collect data from middle school survery. They tabulate percentages by grade level. They create a graph to display the survey results.
Curated OER
M & M Madness
Second graders graph M & M's by color. In this graphing lesson plan, 2nd graders first predict how many of each color they think are in a handful of M & M's. Then they graph the amounts of each color on a computer program....
Curated OER
Tune...Um!
Students collect real data on sound. For this algebra lesson, students use a CBL and graphing calculator to observe the graph created by sound waves. They draw conclusion about the frequency of sound from the graph.
Curated OER
Making Connections
Eighth graders investigate the input/output model for building function tables. From the data, 8th graders connect tables, graphs, function rules, and equations in one variable. They work backwards to determine function rules for given...
Curated OER
Equation of a Line
In this equation of a line worksheet, 9th graders solve and complete 4 different multiple choice problems. First, they use the median fit method to determine the equation that most likely represents the line of best fit for the data...
Curated OER
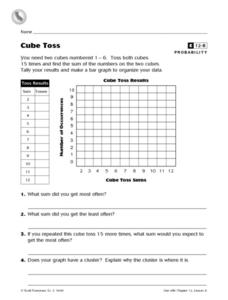
Cube Toss
In this probability and graphing worksheet, students solve 8 problems in which data from a cube toss is displayed on a table and graph. Students answer the questions about their results.
Curated OER
What's Up With the Weather?
Learners examine raw data about temperatures throughout the world and record their observations. They work together to graph a specific year of data. They calculate an average temperature and discuss their findings.
Curated OER
Recording Frequency
First graders analyze nursery rhymes and gather data about word frequency. In this frequency lesson, 1st graders create graphs and tables. Students interpret the data.
Curated OER
How Fast Is Your Car?
Eighth graders discover the relationship between speed, distance, and time. They calculate speed and represent their data graphically. They, in groups, design a ramp for their matchbox car. The goal is to see who's ramp produces the...


