Curated OER
Prom Date
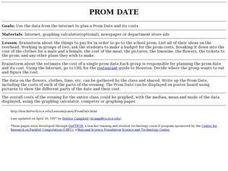
Students use the internet to research the cost of going to the school prom. As a class, they brainstorm about the things needed in order to go to the dance and use advertisements to make a budget. After all of the data is collected,...
Curated OER
Virtual Field Trip
Learners calculate gasoline cost per mile on a virtual field trip. They calculate the gasoline costs and travel time for each of the 2 routes, and record on a data sheet. They use Excel to create data tables for mileage, gasoline...
Curated OER
Leaf Weight-Loss Plan
Learners measure the weight of a container of leaves daily to discover how quickly it grows lighter as the foliage dries.
Curated OER
It's Your Choice
Students compare data and determine the appropriate way to organize the data. They use physical graphs, pictographs, and symbolic graphs to display their data. In addition, they complete a Venn diagram.
Curated OER
"Favorite Fairy Tale Characters"
Third graders enter the results of their survey on a spreadsheet. They construct a bar graph showing the results.
Curated OER
TV Viewing
Students test a hypothesis to see if there is a direct correlation between number of hours of TV viewing and academic grade. They collect and compile data to enter on a spreadsheet and create a word processing document supporting their...
Curated OER
Heads-Up Probability
Second graders use tree diagrams to predict the possible outcomes of coin tosses. The data they collect and graph also help them predict the likelihood of getting heads or tails when tossing coins the next time.
Curated OER
Checking County Numbers
Learners use their county's information page to gather information about their community. Using the information, they create graphs from the tables provided and interpret the data. They write a paragraph showing their interpretation of...
Curated OER
Spreadsheets in Science
Fourth graders create spreadsheets, explore patterns and make predictions based on the information. They select the appropriate graph to display the spreadsheet data. They search and sort prepared data bases to gain knowledge for...
Curated OER
U.S. Leadership in World War II
Students examine the political and military leadership of the United States during World War II. Once they have assessed the qualities of leadership, they compose essays identifying specific qualities of these leaders . Using charts,...
Curated OER
Puerto Rico Pyramid Scheme
Students are introduced to the purpose of a population pyramid. In groups, they compare and contrast various population pyramids and identify trends about the civilization being examined. With a focus on Puerto Rico, they work together...
Curated OER
How Wealthy Are Europeans?
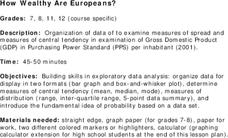
Students investigate measures of central tendency. They examine compiled data and conduct critical analysis. The graph is focusing on the gross domestic product data. The lesson also reviews the concept of putting values in order of...
Curated OER
Make Your Own "Weather" Map
High schoolers create their own "weather" map using data from x-ray sources. They analyze and discuss why it is important to organize data in a fashion in which is easy to read. They compare and contrast different x-ray sources using a...
Curated OER
Fishkill
Students analyze data to determine the effect of thermal pollution on a certain species of fish. They graph temperature and dissolved oxygen and make inferences on the impact a change in temperature could have on the fish. As a class...
Curated OER
Agriculture, Weather, Economy and Indiana
Fourth graders, in groups, investigate the role of weather in Indiana's farming economy. They make a prediction as to weather and its effect on the economy of Indiana. They present their data using a media presentation of data...
Curated OER
Math Lesson: How Many People Live There?
Students are able to calculate the population density of a country, and calculate the population density of large cities in that country. They are able to create an appropriate graph to represent their data for that country.
Curated OER
Lift vs. Airspeed
Young scholars, after reading the explanation given below, use FoilSim and a graphing calculator to complete the activity to determine the relationship between airspeed and lift of an object by interpreting data.
Curated OER
What Does Average Look Like?
Fifth graders, in groups, study the concepts of range, median, mode, and mean through the use of graphs drawn from models. They use manipulatives to represent data that they have collected within groups.
Curated OER
Discovering a Law of Space Physics
Learners use data collected by an astronomer to determine the relationship between the time it takes the planet to orbit the sun and the average radius of the planet's orbit around the sun. Students use trial and error to find the...
Curated OER
Math Can Be Mean!
Fifth graders are introduced to the topic of means. Calculating the mean, mode and median, they describe what each set of numbers tell and do not tell about the data. They use a line graph to practice finding the mean. They also use...
Curated OER
Discover Science
Students practice scientific research skills. In this lesson about science, students gain experience with the following skills: comparison, observation, identification, and data gathering. Students will go from station to station and...
Curated OER
Streamflow
Learners discuss the topic of streamflow and how it occurs. They take measurements and analyze them. They interpret data and create their own charts and graphs.


