Curated OER
Record 'The' Results
Third graders predict how many times they'll see the word "the" in a newspaper page and highlight all the "the"s they find. After reviewing definitions of range, median, mode, mean they create a Stem and Leaf Plot and a Back-to-Back Stem...
Curated OER
Publishing a Book Review
Pairs use desktop publishing software, as well as digital video and camera equipment, to craft a book review. These reviews are then shared with others in the school community through the class or school website.
Curated OER
Water Fun
Students examine uses for water. In this water lesson, students discuss how they use water. As a class students make a PowerPoint by naming one swimming safety rule. Students compare and contrast fishing for fun and fishing for survival.
Curated OER
Putting Your Best Foot Forward
Third graders measure their feet and their parents' feet, record data on computer-generated graphs, and calculate and record mean, median, and mode.
Curated OER
Mathematical Magazines
Young scholars classify and tabulate the type of advertisements found in a collection of magazines. Determination is made on what percent of the total number of ads each type represents. They present their results orally and in a graph.
Curated OER
Mathematical Magazines
Students look through magazines and calculate the percentages of the types of ads in the magazines. In this percentages lesson plan, students create a graph to show their results.
Curated OER
Statistics: Misleading or Accurate?
Students explore the concept of misleading statistics. In this misleading statistics lesson, students play a game of tag and graph the number of times each student gets tagged. Students use the graph to determine the fastest runner in...
Curated OER
Planet Protectors
Students explore ways to protect the earth. In this environmental issues and technology activity, students investigate the water quality in their community and compare their findings to the water quality in other geographic areas. ...
Curated OER
Linear Functions
Students solve and graph linear equations. In this algebra instructional activity, students collect data and plot it to create a linear function. They identify the domain and range of each line.
Curated OER
An Introduction to the Natural Logarithm (ln)
Students explore the dose response principle, an introduction to what the "natural log" (ln) is and how it behaves. They create and analyze a dose response graph.
Utah LessonPlans
Seed Sort
Students form a variety of categories for seed mixes (wild bird seed or 15 bean soup) and create graphs to display their categories.
Curated OER
A Bar of Many Colors
Second graders use colored candies to collect data, construct double bar graphs, and find averages.
Curated OER
Leap Frog Experiment
Second graders ask questions and design an experiment to explore different spinners in "The Leap Frog" board game. They conduct their experiment, collect information and interpret the results using a graph.
Curated OER
Spreadsheet Budget Project
Eighth graders record all the food they eat for one week, compute the costs for all of this food, and display the different categories on a spreadsheet and then convert to a chart.
Curated OER
Ecosystems
Students create plots of land in three different ecosystems and use AppleWorks to collect data for research. This lesson includes a downloadable worksheet and can be accomplished in four days.
Curated OER
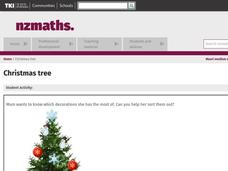
Christmas Tree
Ask the students for ideas on sorting the decorations so that they could tell someone what was in the box. Students share idea for sorting a box of Christmas decorations so that they could tell someone what was in the box. They share...
Curated OER
Fractions and Fact Families: Jump Kangaroo Jump!
Second graders practice with fractions and fact families. In this fractions and fact families lesson, 2nd graders participate in a series of activities to assist them with understanding fractions. Activities include graphing, creating...
Curated OER
Introducing Temperature Measurement
Students explore temperature and use Celcius thermometers to measure and graph the temperature in the classroom daily. They estimate what they think the temperature might be and then find the actual temperature in the room.
Curated OER
Slopey Math
Students identify the slope of a line and use it to solve real life problems. In this algebra activity, students write linear equations in slope intercept form and make a correlation to its relation to the real world. They use the slope...
Curated OER
Impact Craters and Water on Mars
Pupils explore for water on Mars using impact crater morphology. During this lab, students: investigate how to use the equation writing and graphing capabilities in Microsoft Excel, then develop and apply an impact crater depth-diameter...
Curated OER
Leap Into Exponential Functions
Students use properties of exponents to solve equations. In this algebra lesson, students add, subtract, multiply and divide exponential functions. They graph and differentiate between exponential growth and decay.
Curated OER
How Effective is Perspiration at Cooling?
Students collect data on the cooling of water in two different test tubes, one that is wrapped in wet newspaper and one in dry newspaper. They then relate this cooling effect to the body's perspiration.
Curated OER
Did Somebody Say...? Where to Work?
Students conduct research on four fast food restaurants to determine where they might apply for a job. They conduct research on hourly rate, working conditions, and benefits, construct a spreadsheet with a graph, and present their...


