Curated OER
Light Plants and Dark Plants, Wet Plants and Dry Ones
Learners plant sunflower seeds in plastic cups, and once germinated, these are exposed to different conditions of light levels and/or soil moisture contents. Students measure growth of the seedlings every few days using non-standard...
Curated OER
Using a spreadsheet and the Internet to learn about stock market performance
Students record the progress weekly of a business of their choice on the stock market, graph those results, research and report on current news and how it pertains to the companies recent performance.
Curated OER
Natural Resources
Fifth graders begin the lesson by identifying the different types of natural resources. As a class, they discuss how environments are destructed and how the loss of one natural resource can affect the economy. Using a map, they label the...
Curated OER
Ants in Your Pants
First graders read "One Hundred Angry Ants" by Elinor Pinczes. They identify various sums that equal ten and display them on a chart.
Curated OER
Fossils: The Eras of the Earth's History
Students research the four geologic eras of Earth's history. In this extension on a fossils instructional activity, students research the different eras of Earth's history. Students use AppleWorks to create a bar graph containing...
Curated OER
Math: Party Time!
Twelfth graders discover how to calculate the total costs for a party. They determine the unit prices of food and supplies, the quantities needed, and complete a chart displaying their findings. Students calculate the costs per serving...
Curated OER
Graph Both Crusts
Fourth graders calculate the angles and construct a pie graph of the percentages of the elements in the continental and oceanic crusts. Then they analyze the results. They can be assigned the task of researching the percentages.
Curated OER
Heart Smart in a Heart Beat
As an introductory activity, young statisticians measure their heart rate at rest and after exercise and compute the mean and median, and create a box & whisker plot. This is followed by watching a video (that no longer seems to...
Curated OER
Sampling Snoops
Students practice formulating a hypothesis and designing an experiment to test the hypothesis. They identify several sampling techniques they can use to test their hypotheses.
Curated OER
Rubber Band
Eighth graders investigate what would happen to the length of a rubber band as more and more rings were hung on it. They base their explanation on what they observed, and as they develop cognitive skills, they should be able to...
Curated OER
Weather "Whys" : Introduction to Weather
Students discuss weather forecasts and different types of weather. In this weather instructional activity, students observe the weather and learn a weather song. They listen to a story and see weather measurement tools.
Curated OER
And the Winner Is...
Third graders participate in an election project. They collect data to create a spreadsheet from which a graph is generated.
Curated OER
Inventors Unit Survey
Students develop and conduct a survey for their inventors unit. They create a five question survey and tally the survey results, and create a graph using Microsoft Word and Graph Club 2.0.
Curated OER
Environmental Mathematics
Eighth graders determine food that they would need to survive in the wild. They graph the best foods for their environments and rate the survivability rate for each member of their group.
Curated OER
Tally Time
Students create a tally chart. In this math and health instructional activity, students discuss healthy foods and create a tally chart showing the number of students who like to eat healthy foods.
Curated OER
Paper Planes
In this unit, 3rd graders investigate one variable to see if they can make a paper plane fly farther. They use scatter plots to establish a possible relationship between variables then use what they have found to make a paper plane to...
Curated OER
Box And Whiskers
Learners investigate the concept of using box and whisker plots. They demonstrate how to use them to compute median, mode, and range. Students compare and contrast the complete and systematic processes use to solve problems. This is done...
Curated OER
What Do Plants Need to Grow?
Fourth graders control variables to determine the effect on plant growth. They collect information by observing and measuring and construct simple graphs, tables, maps and charts to organize, examine and evaluate information.
Curated OER
The Stock Exchange Phase I
Second graders select a stock and follow its ups and downs, using graphs to show its success.
Curated OER
Valentine Hearts
Students sort candy Valentine hearts into groups and create individual graphs.
Curated OER
How Tall Are We?
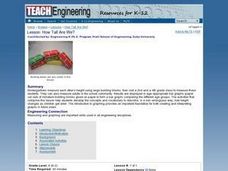
Young scholars in a Kindergarten class measure each other's height using large building blocks and then visit a 2nd and a 4th grade class to measure those students. They display the results in bar graphs, comparing the different age groups.
Curated OER
Water Resources
Learners explore the differences between surface water and ground water. They collect data using maps and graphs and investigate a Texas river basin and a nearby aquifer. They complete a written report of their findings regarding the...
Curated OER
Finding the Flu
Students work to determine when the flu is most prevalent in the United States. They gather data on their own, create calendar, charts, and graphs, analyze their findings and present them. This is a very appropriate winter lesson!
Curated OER
Best Buy!!
Students use newspaper ads to determine the best buy on products. They enter the information into a spreadsheet and then use word processing software to complete a written analysis, complete with graphs.


