Curated OER
"Mr. Betts and Mr. Potts"
First graders listen to the book "Mr. Betts and Mr. Potts" and examine the career of being a veterinarian. They categorize animals based on whether they could be house pets or not, develop a class pet graph, and list the various...
Curated OER
And Around We Go!
Sixth graders conduct a survey and collect data to construct a bar graph that will then be changed into a circle graph. With the bar graph, 6th graders compare estimated fractions and percentages and estimate percentages. With the circle...
Curated OER
Ladybugs in the Garden
Fifth graders estimate the size a population (ecosystems) Students make a chart from information collected then create a graph (line or bar) from this information. Students do a lesson where they observed, examine, and record data...
Curated OER
Weather... Or Not
Students observe and discuss the local weather patterns, researching cloud types and weather patterns for cities on the same latitude on the Internet. They record the data for 6-8 weeks on a graph, and make weather predictions for their...
Curated OER
Electronic Spreadsheets & Iditarod 2000
Students use the Internet for gathering information for Iditarod race journals. They use a spreadsheet program for entering data and making charts for showing changes in speeds achieved over a period of four weeks in timed writings in...
Curated OER
Nicotine Why is it so hard to quit smoking?
Students interview both smokers and nonsmokers to get their point of view on the topic. They prepare bar graphs based on the data accumulated by the class during the interviews.
Foundation for Water & Energy Education
How is Flowing Water an Energy Source? Activity C
Can the force of falling water through a tube vary by altering the diameter of the tube or its height? That is what physical scientists aim to discover in this activity, the third in successively more revealing activities on the power of...
Missouri Department of Elementary
If It’s to Be, It’s Up to Me
Here's a clever switch on the tale of Pandora's Box. Rather than lifting the lid and having problems escape, class members write a problem on a strip of paper and place it in Pandora's Problem Box. A student then pulls a problem from...
Center for Learning in Action
Density
Explore the concept of density within states of matter—gases, liquids, and solids—through a group experiment in which young scientists test objects' texture, color, weight, size, and ability to sink or float.
Virginia Department of Education
How Much is that Tune?
Tune in for savings! Scholars investigate pricing schemes for two different online music download sites. After comparing the two, they determine the numbers of songs for which each site would be cheaper.
Missouri Department of Elementary
Finding the Positive
To instill the importance of a positive classroom community small groups create a collage out of magazine clippings that highlight three characteristics of self-awareness. Written examples accompany the finished product. Groups turn in...
Missouri Department of Elementary
STAR Deputies, Unite!
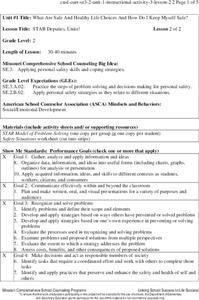
STAR deputies unite! Scholars gather in small groups to solve problems using the STAR method. Pupils read a card that describes a situation that requires problem-solving. They role-play the scenario in front of their peers.
Missouri Department of Elementary
Dealing with Peer Influence: What Are Bullying and Harassment?
Scholars examine examples of peer pressure and discuss how specific actions negatively affect one's well-being. Learners gather in small groups to write two scenarios in which peer pressure is used. They reference the STAR method in how...
Ohio Literacy Resource Center
Converting Units of Measure
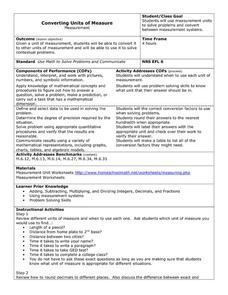
Follow six steps to implement this series of metric worksheets. Here, mathematicians exhibit their knowledge of problem solving, while converting units of measurement and label their answers with the applicable unit name.
Texas Instruments
TI-Nspire™ CAS
When it comes to rating educational calculators, this calculator is always near the top of this list. Now it's available as an app. There is a lot of calculator power wrapped up in this app. Not only is this a fully functioning...
Texas Instruments
TI-Nspire™
We landed on the moon with less computing capabilities than you can find in this app! Here is a multiple function calculator that takes all the power you get from a handheld and adds the wonderful large screen that only a tablet can...
Curated OER
Design a Butterfly
Students access prior knowledge of butterflies. In this butterfly lesson, students create butterflies and compare and contrast their butterflies. Students describe the various body parts.
Curated OER
Groups Coming to America
Fifth graders use text or other references to locate different types of information about the Mayflower and pilgrims. They create a presentation for lower elementary classes about the Pilgrims.
Curated OER
The Garden
Students talk about the types of insects that you might see if you looked in the garden. They then brainstorm for ideas about how to solve the problem, sort objects into categories and display the results and count the objects in a...
Curated OER
Observing Fall Migrants
Students answer questions about the fall migration of the monarch butterfly. The data of observations is graphed and displayed using computer technology. This is a good lesson for crossing the curriculum with mathematics.
Curated OER
Celebrating the Fourth of July!
Students model projectile motion algebraically and graphically; and make predictions based on the quadratic algebraic model.
Curated OER
Slopes and Linear Equations
Young scholars find the slopes of linear functions. In this graphing instructional activity, students analyze linear equations and calculate the slope of the line. They graph a line given the slope and y-intercept.
Curated OER
Choosing a Summer Job
What did you do over your summer vacation. Young wage earners must compare summer job options, and determine when each job earn the same amount and what that amount be. This be done by creating, graphing, and solving systems of...
Curated OER
Fractions, Decimals, and Percents
Students connect different mathematical concepts. They create a circle graph. Students then create a question in which they collect data in order to convert fractions to decimals and decimals to percents.


