Curated OER
Impact Craters Activity
Lunar explorers perform an experiment to understand the size of the craters on the surface of the moon. They layer flour, laundry detergent, and cocoa powder in a pan to model the lunar surface. They drop marbles from different heights...
Alabama Learning Exchange
Building Functions: Composition of Functions
Hammer away at building different types of functions. An engaging lesson plan builds on learners' knowledge of domain and range to create an understanding of composite functions. Young scholars learn to write composite functions from...
Curated OER
An "Average" Golf Score
Ninth graders investigate mean, median, and mode. In this mean, median, and mode lesson, 9th graders research gold data for the top ten scores in two golf tournaments. Students make tables and graphs of the data. Students determine...
Physics Classroom
Component Addition
Learn to analyze vector addition on graph paper through multiple levels of practice problems. Pupils begin with two component addition and move through three and four components to prove mastery as one part of a series on vectors and...
Curated OER
Is the Hudson River Too Salty to Drink?
Students explore reasons for varied salinity in bodies of water. In this geographical inquiry lesson, students use a variety of visual and written information including maps, data tables, and graphs, to form a hypothesis as to why the...
Curated OER
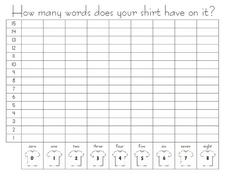
How Many Word Does Your Shirt Have on It? --class Bar Graph
In this math worksheet, students participate in a group bar graph activity. Students survey classmates about how many words, if any, are on their shirts. Results are plotted on a bar graph.
Curated OER
Show Me!
Students analyze and interpret graphs. In this graphing lesson, students view a video and construct their own graphs (line, circle, bar) from given sets of data.
Curated OER
What's Your Favorite Season?
Pupils collect data on the favorite seasons. In this data collection and analysis lesson, students learn about displaying data on charts and graphs. They collect data about the favorite seasons of the children in their class and display...
Curated OER
Reading and Making Pie Graphs
In this pie graphs worksheet, students solve 10 different problems that include reading a pie graph. First, they use the pie graph to respond to 5 questions that follow. Students determine the year that had the smallest and largest...
Curated OER
French Fry Run
Student explore estimation and measurement. In this measurement lesson plan, 2nd graders measure french fries, graph their data, and determine the size of french fries that is the best value. Students practice how to add prices and...
Curated OER
Froot Loops to the Max - 2
In this Froot Loops to the max worksheet, middle schoolers complete and solve 5 problems related to a box of Froot Loops cereal. First, they determine how many of each color is represented in the box of Froot Loops. Then, students...
Virginia Department of Education
Transformation Investigation
Graph it! Investigate transformations with a graphing calculator. Pupils graph sets of linear functions on the same set of axes. They determine how changes in the equation of a linear function result in changes in the graph.
Curated OER
Meatiest States: Graph Problem Solving
For this graph problem solving worksheet, learners analyze a graph that shows commercial red meat production in five states. Students answer 5 word problems using the data on the graph.
Curated OER
Use a Graph Reteach 4.8
For this graph worksheet, students solve 3 problems using a data table and bar graph. Students write number sentences to figure out answers to the questions about kinds of toys in a shop.
Curated OER
Nine Examples for Tables, Pictographs, Mean. Median, and Mode
In this graphical representation of data and measures of central tendency worksheet, students calculate mean, median, and mode and answer questions related to graphs, tables, and pictographs.
Curated OER
Weather Data Analysis
In this weather worksheet, students read a data table comparing the temperature and weather conditions at three different locations. Students use this data to complete 8 fill in the blank, 1 short answer question, and one graph.
Curated OER
Decisions, Decisions, Decisions
Students examine graphs to find the most appropriate for various kinds of data. In this graphing instructional activity, student create bar, line and circle graphs. Students create graphs electronically and manually interpreting the data.
Curated OER
Graphing Favorite Fruit
Third graders take poll and sort data, enter the data to create a spreadsheet and create bar and pie graphs.
Curated OER
Graphing
Learners investigate graphing. In this bar graph lesson, students view an informational website about graphing, then construct a class birthday bar graph outside with sidewalk chalk. Learners choose a survey topic, then collect data and...
Curated OER
Scatter Plots
In this statistics instructional activity, 11th graders analyze different scatter plot graphs for positive, negative and no correlation. They graph their data and analyze it using scatter plots.There is 1 question with an answer key.
Curated OER
What Influences Reaction Rate?
Learners study reaction rates, what determines how fast a reaction happens and how the chemical changes occur. In this reactions lesson students complete a lab where they use Alka-Seltzer to observe reaction rate and create a graph with...
Curated OER
ou are the Researcher!
Students conduct a census at school. They collect data, tally it, and create a frequency table. Students display their data in three different types of graphs. They write complete sentences describing the graph.
Curated OER
Making Connections
Eighth graders investigate the input/output model for building function tables. From the data, 8th graders connect tables, graphs, function rules, and equations in one variable. They work backwards to determine function rules for given...
Curated OER
Immigration Graphs
Fourth graders study immigration. In this graphing lesson, 4th graders make a population graph of people who have immigrated to Indiana.


