Virginia Department of Education
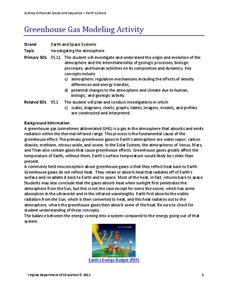
Greenhouse Gas Modeling Activity
Why are greenhouse gases called greenhouse gases? Young Earth scientists learn about greenhouse gases though experimentation in the second installment of a 3-part series. They use lamps to model radiant energy as well as warming through...
Curated OER
The Survey Says
Young scholars experience the development of statistical data. In groups, they construct a survey questionnaire for a target audience. Students produce the questionnaire, distribute it, collect it, and tabulate the data. Using EXCEL,...
EngageNY
Comparing Linear and Exponential Models Again
Making connections between a function, table, graph, and context is an essential skill in mathematics. Focused on comparing linear and exponential relationships in all these aspects, this resource equips pupils to recognize and interpret...
Natinal Math + Science Initative
Slope Investigation
Context is the key to understanding slope. A real-world application of slope uses a weight loss scenario with a constant rate of change to introduce the concept of slope of a line, before it makes a connection to the ordered pairs and...
Curated OER
The Greenhouse Effect
Seventh graders investigate the temperature change in open and closed containers. In this earth science instructional activity, 7th graders relate this lab activity to greenhouse effect. They create a line graph from data collected in...
Curated OER
What Color is Your Air Today?
Students investigate air quality. They analyze Air Quality Index data tables, interpret the graphs, complete a worksheet, and discuss trends in air quality.
Curated OER
Lesson 3: Life Cycle of Brassica Plants
Students investigate the life cycle of brassica plants. In this science lesson, students observe each stage in the life cycle of their plant. Students record their observations and graph the data. Students
NASA
Newton Car
If a car gets heavier, it goes farther? By running an activity several times, teams experience Newton's Second Law of Motion. The teams vary the amount of weight they catapult off a wooden block car and record the distance the car...
Curated OER
An Enzyme- Substrate Model
Students explore reaction rates of an enzyme-mediated reaction. They examine the effects of environmental variables on enzyme function. Students collect, graph, and analyze data relating to the reaction.
Wild BC
The Greenhouse Effect: Warming the Earth Experiment
First in a two-part lesson on the greenhouse effect, this lesson involves a classroom demonstration of the phenomenon, and a lab group experiment with color and absorption. Although there are easier ways to demonstrate the greenhouse...
Curated OER
Graphic Favorite Breakfast Foods
Second graders graph data based on a class survey of their favorite breakfast foods. In this graphing lesson plan, 2nd graders take a class survey of their favorite breakfast foods. Then they take that data and put it into a computer...
Curated OER
Beans and Birds: A Natural Selection Simulation
Young scholars solve the following problem concerning the evolution of seed color in pinto bean plants: "How does natural selection change the frequency of genes or traits over many generations?" They use the constructivist approach to...
Curated OER
Hurricane Frequency and Intensity
Students examine hurricanes. In this web-based meteorology lesson, students study the relationship between ocean temperature and hurricane intensity. They differentiate between intensity and frequency of hurricanes.
Curated OER
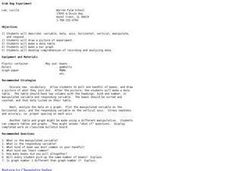
Grab Bag Experiment
Students analyze and record data. In this lesson about graphing and gathering data, students learn about the step of an experiment. Students learn new vocabulary, sort beans, record the data, and graph the data. Students add a variable...
Curated OER
VARIABLES AND PATTERNS, USE AFTER INVESTIGATION THREE. DISCRETE OR CONTINUOUS LINEAR RELATIONS.
Learners discover for which kind of linear function is appropriate to use the "scatter" or the "connected" term. In this instructional activity, students investigate functions using variables, patterns book, graph paper, rulers and the...
Curated OER
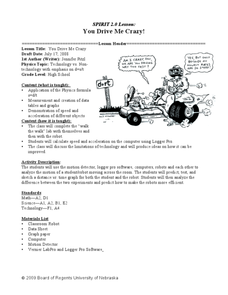
You Drive Me crazy
Students calculate the distance and acceleration of an object. In this algebra lesson, students collect data and create table and graphs to analyze it. They complete a lab as they collect and analyze data on acceleration and distance.
Curated OER
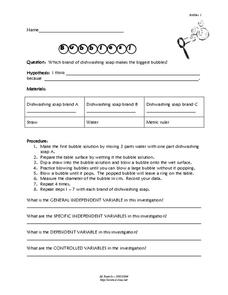
Bubbles
Young scholars experiment bubbles. In this scientific method lesson, students identify variables used in proper experiment design. Young scholars conduct experiments with different brands of dish-washing detergent to determine which...
Curated OER
Bodacious Buttons
First graders graph a data set. Given a set of buttons, 1st graders sort them into categories using specific attributes. They graph the number of buttons in their set based on their attributes using a variety of graphs. Students share...
Curated OER
Statistics Newscast in Math Class
Students study sports teams, gather data about the teams, and create a newscast about their data. In this sports analysis instructional activity, students research two teams and define their statistical data. Students compare the two...
Curated OER
Probability: The Study of Chance
Students practice the basic principles of probability by conducting an experiment, determining if a game is fair, collecting data, interpreting data, displaying data, conducting analysis, and stating and applying the rule for probability.
Curated OER
Seed Growth
Students develop an independent procedure to investigate the germination of two types of seeds. Students must construct data tables or charts to record observations and results, graph the data, and analyze the data.
Curated OER
Hopes and Dreams: A Spreadsheet Lesson Using Excel
Fourth graders read "The Far Away Drawer" by Harriet Diller and discuss the story as a class. After discussion, 4th graders create a t-shirt GLYPH about their hopes and dreams,share their information with the class and create spreadsheets.
Curated OER
Heating of Water: Water Vapour
Seventh graders read the directions printed on their worksheet and follow them carefully. They set up a beaker with a tripod and Bunsen burner under it. They record the temperature of water every 30 seconds. Students graph the data and...
Curated OER
Lessen the Loan
Middle-schoolers explore the concept linear equations. They use the internet to navigate through videos and problems. Pupils problem solve to determine rates of change, slope, and x and y-intercepts.


