Curated OER
Let's Graph It!
Students graph the height of others in centimeters and inches, find the slope of line in order to calculate the conversion factor between centimeters and inches.
Curated OER
Collecting, organizing and comparing data for cellular telephone buying and calculating average, and median price and best deal per cost.
Pupils research data and develop statistical methods such as mean and median price and make convincing arguments as powerful ways for decision making.
Curated OER
Battery Depletion and Piecewise Linear Graphing
Students examine a recent flight of Pathfinder. In groups, they use the information to create a table of values showing the battery charge of the space machine. They predict what the charge would be further on in the mission. They use...
Curated OER
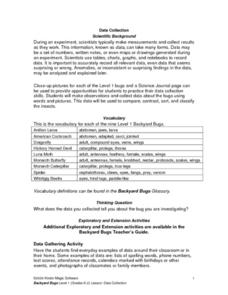
Science: Backyard Bugs Data Collection
Students practice data collection skills by observing common bugs found in their local environment. Once the data is collected they complete data sheets to compare, contrast, sort, and classify the insects. The lesson includes...
Curated OER
Histograms and Statistical Graphics
In this statistics worksheet, students solve 6 data problems. They construct a histogram of given data, they create a frequency polygon, and a stem and leaf diagram. Students create a dot plot and a pie chart for given data sets. On the...
Curated OER
Great Tasting Shapes
Fifth graders investigate the concept of median, mode, and range using a simple model for display purposes. They examine different shaped crackers out of a box and identify the ones that occur the most. Then the calculations for the...
Curated OER
Saving Energy Through Ecological Landscape Design
Students are able to transcribe to scale the plant features of a common landscape. They determine true north and south and collect and record data on a table. Students calculate a rating for and describe a definition of insulation and...
Curated OER
Exercise Those Statistics!
Students participate in various activities, measuring their pulse rates and recording the data. They analyze the statistical concepts of mean, median, mode, and histograms using the data from the cardiovascular activities.
Curated OER
Is It There?
Students participate in a lesson designed to illustrate these concepts using simple materials. They use Science process skills to observe, measure, predict, make inferences, and communicate while completing the activity. Proper safety...
Curated OER
Checking County Numbers
Learners use their county's information page to gather information about their community. Using the information, they create graphs from the tables provided and interpret the data. They write a paragraph showing their interpretation of...
Curated OER
Michigan Virtual Field Trip
Students analyze data from a virtual field trip to Michigan. They conduct Internet research on mileage and travel time between cities, calculate and compare fuel costs, and research and calculate lodging, activities, and meal costs.
Curated OER
Let's Plot Points
Use coordinate grid paper to plot points and identify shapes that are already plotted on the paper by saying their coordinates. Pupils also measure the distance between points and play the game Battleship. There are several web links and...
Curated OER
Exploring Exponential Growth and Decay Functions
Pupils differentiate between exponential growth and decay. In this algebra lesson, students solve exponential equations using properties of exponents. They use the Ti calculator to graph and analyze their functions.
Curated OER
Algebra 1
Students study the functional relationships of a variety of problems. In this functional relationship lesson, students determine the dependent and independent quantities of a given set of data. Students record the data and write it in...
Curated OER
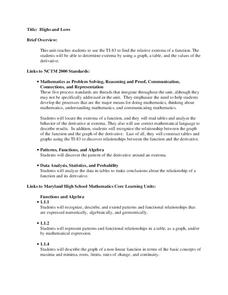
Highs and Lows
Solve problems using integration and derivatives. By using calculus, learners will analyze graphs to find the extrema and change in behavior. They then will identify the end behavior using the derivatives. Activities and handouts are...
Curated OER
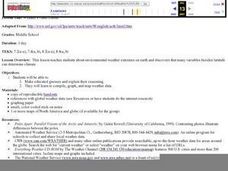
Weather's Outer Limits
Students make educated guesses and explain their reasoning and compile, graph, and map weather data. They then study environmental weather extremes on earth and discover that many variables determine climate.
Curated OER
Ready for Roots
Fourth graders sort seeds and predict what conditions are needed for them to germinate. They keep the seeds moist, observe and measure their growth and graph the results. As the seeds start to grow students compare and contrast the each...
Curated OER
A Fishy Tale
Eighth graders do a research project on a particular species of Atlantic seafood and record and graph information pertaining to commercial landings of that species of seafood. They use a website and an Appleworks spreadsheet.
Curated OER
Investigation-How Many Toothpicks?
Seventh graders use toothpicks to investigate a series of designs and identify patterns. Data is organized and analyzed using tables and graphs, and students make generalizations using algebraic expressions.
Curated OER
How's The Weather?
Students make a box and whiskers plot using the TI-73 graphing calculator. Each student would have their own calculator but they would work in small groups of two or three to help each other enter the data and make the plots.
Curated OER
Probability: The Study of Chance
Students conduct an experiment, determine if a game is fair, and collect data. They interpret data, then display line graph. They conduct analysis of game for probability.
Curated OER
How Alike Are We?
Fourth graders find the range, mode, median, and mean for each of the data sets (height and shoe size). They discuss which measure of central tendency for each data set best represents the class and why. Students graph the shoe size and...
Curated OER
Plugging Into The Best Price
Examine data and graph solutions on a coordinate plane with this algebra lesson. Young problem-solvers identify the effect of the slope on the steepness of the line. They use the TI to graph and analyze linear equations.
Curated OER
Weather Lesson
Learners discuss the weather conditions. They read thermometer, rain gauge, barometer, and wind direction and speed. They record observations of weather conditions and enter information into data base on the computer.


