Curated OER
Cereal Box Blocks and More!
Students sort and categorize different types of boxes and cartons. In this sorting lesson, students designate areas of the room to put different sizes, styles, or colors of boxes. They help their teacher count and graph the different...
Curated OER
Marvelous Mathematics
Students make a table on the computer, but create fractions and equivalent fractions through the use of color. They are able to manipulate fractions in order to gain a greater understanding of the meaning of whole number that is broken...
Curated OER
Paws in Jobland: Lesson Plan 35 - Catch of the Day
Students study information for fish farm workers given in the form of a chart, in order to practice interpreting data while learning about the career of a fisherman. In this data interpretation instructional activity, students read the...
Curated OER
Probing Under the Surface
Eighth graders use a measuring stick to determine the shape of the inside of the bottom of a box, then apply their knowledge to an additional situation. This task assesses students' abilities to make simple observations, collect and...
Curated OER
Functions & Algebra
Students examine linear equations. In this functions and algebra lesson, students write equations in the slope-intercept form. They enter data in a graphing calculator, examine tables, and write linear equations to match the data.
Curated OER
Quartiles, Percentiles, and Cumulative Frequency
In this statistics lesson, 11th graders are asked to calculate the percentiles, quartiles and cumulative frequency given different graphs and data. There are 6 questions with an answer key.
Curated OER
Take a Walk
Sixth graders graph acceleration and practice using the metric system. In this physics lesson, 6th graders take turns timing each other as they walk 15 meters. Students then chart and graph their data using the metric system.
Curated OER
Survey and Tally
Second graders view a model of a survey and tally. In this survey and tally lesson plan, 2nd graders decide on questions for a survey. Students conduct the survey and tally their results. Students create a tally chart. Students view a...
Curated OER
Predator-Prey Simulation
In this predator-prey instructional activity, students simulate the relationship between predators and prey using small squares to represent rabbits and large squares to represent coyotes. They complete 20 rounds of the simulation trying...
Curated OER
Acceleration 2
In this acceleration worksheet, students experiment with varying amounts of mass to observe the effects on the force needed to move an object. Students apply Newton's Second Law of Motion to describe the relationship between mass and...
Curated OER
Activity Three Teacher Page: Collisions
Students after completing this lesson, identify variables that affect the system, and specify which variables are independent; which are dependent. They represent data in a data table and a graph and analyze data and make predictions.
Curated OER
Probabilities for Number Cubes
Learners explore the concept of probability. In this probability lesson, students roll a six-sided number cube and record the frequency of each outcome. Learners graph their data using a frequency chart and keep tally marks in a...
Curated OER
Freshman Project-Part 6-Final Written Report
In this project worksheet, students complete a formal write up of their experiments. This includes a rationale, a purpose, a hypothesis, their experimental design, materials, procedure, data tables with variables, graphs and a concluding...
Curated OER
Snapping Your Fingers
In this algebra worksheet, students calculate how many snaps is done over a certain amount of time. They chart and graph their data. There is an answer key.
Curated OER
The Statistical Nature of Test Data
Students investigate the properties of various metals. They conduct an experiment and gather the data by putting into the proper statistical graphs. The data is analyzed and conclusions are formed according to the properties of the metals.
Discovery Education
Sonar & Echolocation
A well-designed, comprehensive, and attractive slide show supports direct instruction on how sonar and echolocation work. Contained within the slides are links to interactive websites and instructions for using apps on a mobile device to...
University of Georgia
Energy Content of Foods
Why do athletes load up on carbohydrates the evening before a competition? The lesson helps answer this question as it relates the type of food to the amount of energy it contains. After a discussion, scholars perform an experiment to...
University of Georgia
Endothermic and Exothermic Reactions
Equip your chemistry class with the tools to properly understand endothermic and exothermic reactions. Young chemists collect, analyze, and graph data to determine how the Law of Conservation of Matter is applied to chemical composition...
Curated OER
Math Investigations 2
Young mathematicians practice measuring and graphing skills while working in groups to measure objects found in the classroom. Using their measurements, they create one bar graph displaying the lengths and another displaying the widths.
Curated OER
Velocity of Traffic on Highway 26
Physics fanatics time five cars as they pass on the highway. They use the times and a 20-yard distance to calculate velocity. They also graph distance vs. time. A page of student pre-lab questions is provided in addition to the activity...
State of Michigan
Pre-K Mathematics
Kick-start children's education with this pre-school math unit. Offering 31 different hands-on learning activities that develop young mathematicians' pattern and shape recognition, basic number sense, and much more, this is a must-have...
Curated OER
Apple Adjectives
Study different apple varieties and use appropriate adjectives to describe them. Learners alphabetize both the apple names and the adjectives before creating spreadsheet, bar, and pie graphs. A mix of language arts, technology, and math!
National Museum of Nuclear Science & History
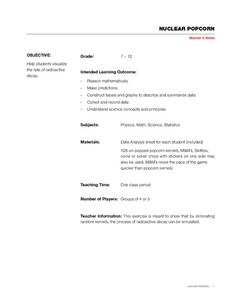
Nuclear Popcorn
Make your lesson on radioactive decay pop with this lab exercise. Using popcorn kernels spread over a tabletop, participants pick up all of those that point toward the back of the room, that is, those that represent decayed atoms. As the...
Balanced Assessment
Survey Says
Examine statistical data that shows an overlap in responses. The data tallies over 100% and learners interpret this data characteristic. They then create a graph to represent the data.


