Curated OER
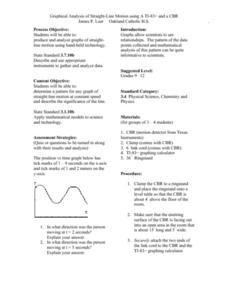
Graphical Analysis of Straight-Line Motion
Students investigate the concept of straight line motion. They determine the pattern and graph it looking for the motion maintained at a constant speed. Students also write a description of the significance of the line. The skill of...
Curated OER
Building Storm Shelters
Sixth graders explore area and perimeter. In this online interactive area and perimeter lesson, 6th graders investigate why the perimeter of rectangles can vary considerably even when the area is held constant. Students construct...
Curated OER
Quadratic Equations and Functions
Students factor and solve quadratic equations. In this algebra lesson, students identify the domain and range of the quadratic function. They graph the parabola and identify the vertex.
Curated OER
Favorite Farm Animals
Students perform a study of farm animals and their babies. They compile a graph of their favorite farm animals. They utilize a spreadsheet worksheet which is imbedded in this plan.
Curated OER
Design-A-Room Project (Part 3 of 3)
Students culminate a unit on measurement with a focus on area and perimeter. They design a floor plan of their dream room on graph paper showing the proper area and perimeter. They plan the budget for their room and make a 3-D scale...
Curated OER
Little Red Corvette
Students investigate the acceleration of a car. In this acceleration of a car lesson, students make a scatter plot of corvette acceleration data. Students find a model to fit the data by taking the integral of the curve created by the...
Curated OER
Understanding Equations of Functions
Students write equations for different functions. In this algebra lesson plan, students observe data and find the function that goes along with that data. The identify the line of best fit.
Curated OER
Introducing Temperature Measurement
Students explore temperature and use Celcius thermometers to measure and graph the temperature in the classroom daily. They estimate what they think the temperature might be and then find the actual temperature in the room.
Curated OER
Direct and Inverse Variation
Eighth graders participate in two data collection activities that involve direct and inverse variation. In the pre-assessment, 8th graders categorize numerical, graphical, and verbal representations as linear or nonlinear and determine...
Curated OER
Using the Production Possibilities Frontier
Students identify the purpose of models and why economists use them. Using a graph, they practice reading and plotting points. They are introduced to a production possibilities frontier and draw their own from data supplied to them on...
Curated OER
Collect the Weather Lesson Plan
Students explore the weather. In this weather spreadsheet instructional activity, students keep track of weather patterns as they use instruments and resources to chart the data the collect in spreadsheet form.
Curated OER
Making Connections
Seventh graders relate patterns with higher math. In this 7th grade math lesson, 7th graders analyze different methods of portraying data. They relate the data to real life scenarios.
Curated OER
The Box Problem
Pupils create graphic, algebraic and verbal ideas of functions. In this algebra lesson, students graph functions and identify the zeros of the functions. They find the domain and range and classify functions as relation or not.
Curated OER
Patterns of International Tourism in Canada
Students retrieve data on the number of international tourists to Canada, analyzing the seasonal patterns and long-term trends for each region in Canada. They retrieve statistical data from E-STAT; and explain the effect of seasonal...
Curated OER
Predator/Prey Relationship
Students study and analyze data collected on the relationship between the snowshoe hare and lynx in Canada over a 28 year period and create a graph. Students also write a response to a proposal to reduce the lynx population.
Curated OER
Water Quality in the Greenhills Stream
Seventh graders conduct year long study of water quality over different seasons using variety of probes, including D.O., pH, conductivity and temperature, that are attached to portable technology. Students select three data points in...
Curated OER
Surface Air Temperature Trends of the Caribbean
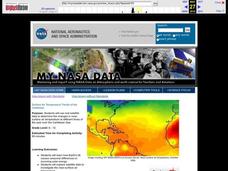
Students investigate the seasonal changes to sea surface and near-surface air temperatures near the equator. They use actual satellite data to track and graph the differences in air and sea temperatures during different seasons in the...
Curated OER
Teaching About the Properties of Water
Learners use video, Internet research, graphs and tables, worksheets and hands-on experiments to investigate the properties of water in a lake environment. They work under direction or through an inquiry process.
Curated OER
Arrange the Classroom (Part 1 of 3)
Fifth graders arrange the classroom using all the moveable objects and through the exploration of area and perimeter. They determine the area of the classroom, create and label model pieces of furniture using graph paper, and create a...
Curated OER
Human Populations Studies: the Ghost of Populations Past
Students compile data on population distribution and develop survivorship curves using information from cemetery tombstones and obituaries. They develop inferences on the changes in population age distribution in their area over time.
Curated OER
Food Groups in our Lunch
Students make a graph. In this food groups and graphing lesson, students pack a sack lunch and then work in groups to tally the number of foods from each food group that they have. Students use the data collected to create a graph using...
Curated OER
Introduction to Polynomials
Students analyze the graphs of polynomial functions, examine vocabulary associated with polynomials, and determine the maximum number of real roots possible for a polynomial
Curated OER
Trends of Snow Cover and Temperature in Alaska
Students compare NASA satellite data observations with student surface measurements of snow cover and temperature. They practice data collection, data correlations, and making scientific predictions.
Curated OER
A Look at Race in America Using Statistics
Eleventh graders explore the issue of racism in America. In this American History lesson, 11th graders analyze charts and graphs on blacks and whites in America.


