Curated OER
What Functions do Two Graph Points Determine?
Your algebra learners write linear, exponential, and quadratic equations containing the same two graph points in this collaborative task.
Curated OER
Walking the Plank
This is a cool math activity. Kids collect and interpret data based on a physical act. A board is balanced between a scale and a step, learners record a peer's weight as it decreases while s/he walks further away from the scale. They...
Curated OER
Graphing Ordered Pairs
Here is graphing worksheet which has pupils graph ordered pairs and label the axis. They graph five ordered pairs and then interpret the data in the graph.
Alabama Learning Exchange
Bloodstain Pattern Doesn't Lie......
An interesting instructional activity on hypothesizing about the diameter of a drop of blood that is splattered. To test their theories, learners work in groups to make blood droplets splatter from different heights. They use graphed...
Agile Mind
Transforming Graphs of Quadratic Functions
In the activity on this webpage, learners use interactive graphing technology to investigate transformations of graphs. In the first part of the task, they look at the graph of a quadratic function with coordinates of a few points...
Curated OER
Shell Graphing
Fifth graders explore the four quadrants of a coordinate grid. In this graphing lesson plan, 5th graders trace sea shells in each of the four quadrants of a coordinate grid and then label the ordered pairs on each shell. For the final...
Curated OER
Solving a Pair of Linear Equations by Graphing
Teach your math lovers how to solve linear equations by graphing. Students identify pairs of coordinates and use it to graph a line and use the TI to graph and observe the line.
Curated OER
Linear Graphs and Equations
In this linear graphs and equations worksheet, students examine points on a graph and identify coordinates plotted on the point. Students determine the slope of a line and write the equation of a line. This three-page worksheet contains...
Curated OER
Stories to Graphs
Students graph their solutions using a linear equation. In this algebra lesson, students rewrite words problems into algebraic equations and graph their solutions. They solve word problems dealing with real lie scenario.
Teach Engineering
Determining Densities
Don't be dense—use a robust resource. The second installment of a five-part Floaters and Sinkers unit has learners determine the densities of several objects. As part of the activity, they learn the displacement method for finding...
Curated OER
Exponential Growth and Decay
Quiz your middle and high schoolers on solving exponential growth and decay. First, they evaluate for a variable given the second variables value. Then, they graph an equation that illustrates the exponential growth or exponential decay...
Curated OER
Graphing Integers
Fifth graders complete an integer graphing activity. In this integer graphing lesson, 5th graders use coordinate grids to help them complete linear functions and integer graphing.
Mathematics Vision Project
Module 6: Trigonometric Functions
Create trigonometric functions from circles. The first lesson of the module begins by finding coordinates along a circular path created by a Ferris Wheel. As the lessons progress, pupils graph trigonometric functions and relate them to...
Concord Consortium
Writing and Sketching II
Find the function that fits. Scholars first identify the graph of a function that looks the same after a horizontal translation. They must then find the equation of a function whose graph lies only in two adjacent quadrants.
Concord Consortium
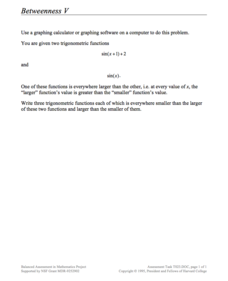
Betweenness V
Take a unique approach to study the graphing of trigonometric functions. Young scholars consider two sine functions and write three functions that will lie between the two given. They use a graphing utility to assist in their explorations.
Concord Consortium
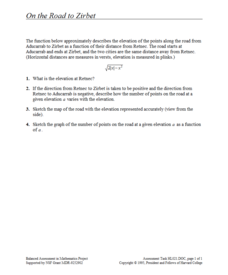
On the Road to Zirbet
The road to a greater knowledge of functions lies in the informative resource. Young mathematicians first graph a square root function in a short performance task. They then use given descriptions of towns and the key features of the...
Concord Consortium
Betweenness IV
Challenge your classes to think between the curves. Given two function formed by the combination of two exponential functions, individuals must write three functions in which all values would lie between the given. The question is...
Curated OER
Graphing Systems of Equations
In this graphing systems of equations activity, 9th graders solve and graph 8 different problems that include solving various systems of equations. First, they use the graphs show to determine whether each system has one solution, no...
Curated OER
Graph Functions: Practice
In this graph functions worksheet, students complete several activities to help them graph functions. Students use the table and the graph to complete the questions. Students also answer two test prep questions.
Curated OER
Graphing Linear Inequalities
In this graphing linear inequalities worksheet, students graph 1 linear inequality. Students walk through each step to graphing the inequality and shading the appropriate region on the graph.
Illustrative Mathematics
Peaches and Plums
According to the resource graph, which costs more: peaches or plums? Algebra learners compare two proportional relationships and then throw in a banana. Leaving out the scale helps students become intuitive about graphing.
Alabama Learning Exchange
How Old is Your Money?
Elementary learners explore coin mint dates. First, they listen to the book Alexander Who Used to be Rich Last Sunday by Judith Viorst. They then sort a collection of coins according to their mint date and put them in order from oldest...
Curated OER
Summer Body Activity: As Big as Me!
Learners explore things that are their size, literally. In this early childhood lesson plan, students use their bodies for measuring and comparing sizes as they work in pairs to complete the activity.
Curated OER
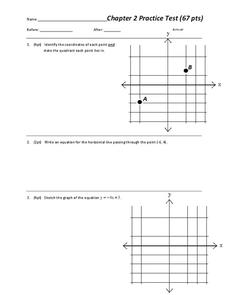
Chapter 2 Practice test
Overall, this worksheet contains a good selection of problems that reviews different aspects of linear equations. Learners examine and graph linear equations, absolute value equations, and inequalities in two variables. The three page...


