Curated OER
Statistical Analysis of Data by Gender
Students examine and identify gender bias, stereotyping, and discrimination in school materials, activities, and classroom instruction. They apply descriptive statistics knowledge to real-world data.
Curated OER
Travel Mug Design
Students create and develop a travel mug. They create visuals and a three dimensional infomercial. They apply an engineering design and demonstrate knowledge of thermodynamics involved in heat transfer. They illustrate Newton's Law of...
Curated OER
A Statistical Look at Jewish History
Learners complete their examination over the Jewish Diaspora. Using population figures, they discover the importance of percentages in exploring trends. They use their own ethnic group and determine how it is represented in the United...
Curated OER
Comparison of Two Different Gender Sports Teams - Part 1 of 3 Measures of Central Tendency
Students gather and analyze data from sports teams. In this measures of central tendency lesson, students gather information from websites about sports team performance. Students analyze and draw conclusions from this data. This lesson...
Curated OER
Tomb Explorer/Temple Explorer
Fourth graders build an explorer vehicle which they program through an obstacle course to enter the tomb or temple to discover artifacts.
Curated OER
Electric Field Mapping in 3D
Students create a 3D vector field map of an electric field. In this physics instructional activity, students measure the voltage inside an aquarium with water. They present their findings and map to class..
Curated OER
Probes, Exploration & Application
Students explore how a surface can be described without seeing it.
Curated OER
Biology: Variation and Classification
Students investigate classification of different animal groups. In this biology lesson plan students list characteristics of themselves and others they know to show differences and how they are classified. Students then answer questions...
Curated OER
Different Perspectives of Oregon's Forest Economic Geography
Students locate the many forests located in Oregon. In groups, they use the internet to research employment data on wood products made in the state. They discuss how looking at information presented in a different way can change their...
Curated OER
Salaries
Students are engaged in the study of salaries and how they vary according to different occupations. They conduct research using a variety of resources in order to summarize the earnings potential in the human services field.
Richland Community College
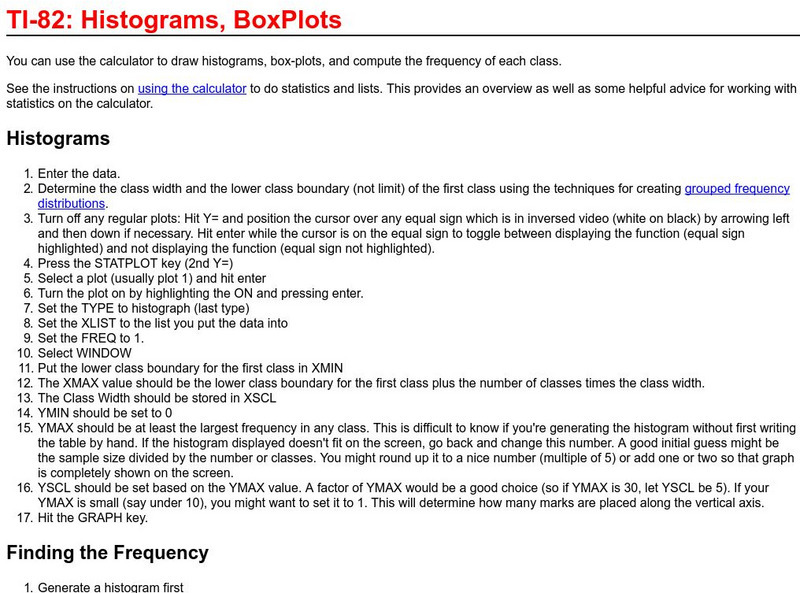
Richland College: Ti 82 Histograms / Box Plots
Richland College provides a step-by-step procedure on how to use a TI-82 to construct histograms and box plots and then use this to find frequency distribution.
Other
Online Statistics Education: Graphing Distributions [Pdf]
This is the second chapter of a statistics e-text developed collaboratively by Rice University, University of Houston Clear Lake, and Tufts University. It looks at many different types of data displays and the advantages and...
ClassFlow
Class Flow: Data Analysis Using Graphing
[Free Registration/Login Required] This flipchart allows students to analyze data using appropriate graphs, including pictographs, histograms, bar graphs, line graphs, circle graphs, and line plots introduced earlier, and using...
National Council of Teachers of Mathematics
Nctm: Illuminations: Advanced Data Grapher
The Advanced Data Grapher can be used to analyze data with box plots, bubble graphs, scatterplots, histograms, and stem-and-leaf plots.
CK-12 Foundation
Ck 12: Types of Data Representation: Graphic Displays of Data
[Free Registration/Login may be required to access all resource tools.] Here you will explore displays of data using bar charts, histograms, pie charts and boxplots, and learn about the differences and similarities between them and how...
Texas Instruments
Texas Instruments: Box and Whiskers
Lesson engages participants in various activities designed to enhance the learners understanding of box and whiskers graphs in various formats.
Texas Instruments
Texas Instruments: Create Box and Whisker Plots
Students use a graphing calculator to create box-and-whisker plots and learn the usefulness of them. Students identify the five summary statistical values of data sets - minimum, first quartile, median, third quartile, and maximum values.
Khan Academy
Khan Academy: Comparing Data Displays
Practice interpreting and comparing dot plots, histograms, and box plots. Students receive immediate feedback and have the opportunity to try questions repeatedly, watch a video or receive hints.
Houghton Mifflin Harcourt
Holt, Rinehart and Winston: Homework Help Independent Practice: Scatter Plots
Get independent practice working with scatter plots. Each incorrect response gets a text box explanation and another try. Correct responses are confirmed.
Math Aids
Math Aids: Graph Worksheets
Great resource to practice and strengthen math skills pertaining to graphs. Math worksheets are printable, may be customized, and include answer keys.
National Council of Teachers of Mathematics
Nctm: Illuminations: Mean and Median Box and Whisker Plotter
A computer applet that will draw any box and whisker plot with student's data input.
Varsity Tutors
Varsity Tutors: Hotmath: Practice Problems: Box and Whisker Plots
Nine problems present various aspects of using box-and-whisker plots. They are given with each step to the solution cleverly revealed one at a time. You can work each step of the problem then click the "View Solution" button to check...
Varsity Tutors
Varsity Tutors: Hotmath: Algebra Review: Box and Whisker Plots
Find a quick, concise explanation of a Box-and-Whisker Plot. An example is given and clearly explained.
Scholastic
Scholastic: Cultivating Data
Students will understand key concepts of data analysis and their graphic representations. Students will construct and interpret data tables, line plots, box-and-whisker plots and stem-and-leaf plots, scatterplots with line of best fit,...


![Online Statistics Education: Graphing Distributions [Pdf] eBook Online Statistics Education: Graphing Distributions [Pdf] eBook](https://d15y2dacu3jp90.cloudfront.net/images/attachment_defaults/resource/large/FPO-knovation.png)


