Curated OER
Graphs Galore
Fourth graders conduct surveys to collect data. They analyze and interpret the data, then determine which type of graph is appropriate for the data. Students use the data to make predictions, discover patterns and draw conclusions...
Curated OER
Graphing Our Favorite Candy Bars
Students use ClarisWorks to graph class' favorite candy bars on a bar graph.
Curated OER
Diagnosing Allergies Through Data Collection
Students research and organize information about allergies. In this data collection lesson, students watch a video about allergies. Students create a histogram using the information collected. Students complete the 'Displaying Survey...
Curated OER
Make a Tally
In this tally chart activity, learners read the word problems and use the information within the problem to make a tally chart. Students use the tally charts to help them finish and solve the word problem.
Curated OER
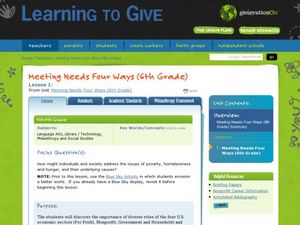
Meeting Needs Four Ways: The Drive (6th)
Students study the U.S. economic sectors and their philanthropic role in communities. In this civil society activity, students brainstorm and classify businesses in their community. Students discuss the for-profit, nonprofit, government...
Curated OER
Blowing in the Wind
Pupils identify and interpret maps, graphs, charts, tables and political cartoons. Students identify what a compass rose is and review its meaning in relation to standard directions. Pupils design their own weathervanes. Students pencil...
Curated OER
Fun With Graphs
First graders read about making graphs and lean how to make graphs using "The Graph Club" software.
Curated OER
Working with Frequency Tables
In this Working with Frequency Tables worksheet, students analyze data that is organized in simple frequency charts. They calculate average from data presented in a frequency table, calculate a cumulative score, and identify data that...
Virginia Department of Education
Functions 1
Scholars learn what it means for a relation to be a function and see various representations of functions. After learning the definition, they participate in a card sorting activity classifying relations as functions or not.
Curated OER
Measuring Soil Temperatures at South Penquite Farm
Learners investigate soil temperatures. In this graphing and earth science lesson, students insert temperature probes into different types of soil at varying depths. Learners complete a data chart and construct a related graph...
Curated OER
How the Environment Affects Our Health
Ninth graders explore how the environment affects health. In this infectious disease lesson, 9th graders investigate what environmental situations cause infections diseases. Students study the symptoms, treatments, prevention, and...
Curated OER
Data Analysis
Students double check their data collections of Top 20 singles that they've been collecting for several days. Types of data is reviewed in detail and a variety of questions are asked for retention factors of mastery. They draw a tally...
Sri Atmananda Memorial School
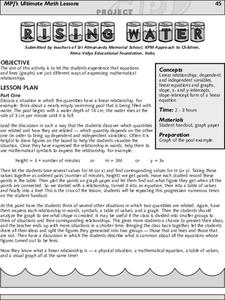
Rising Water
An engaging, and not to mention attractive, lesson plan has prealgebra and beginning algebra scholars examining linear relationships. They consider the rising water level as a swimming pool is being filled. They do so by charting and...
Curated OER
Quarter, Nickel, Dime....
An engaging game called, "Quarter, Nickel, and Dime" is presented in this math lesson. Players are given an envelope with slips of paper that represent the three coins. In pairs, they play the game 18 times, and the whole class charts...
Curated OER
Waves
Light waves and sound waves are the focus of this science lesson designed for 5th graders. Besides discovering how these waves travel, learners also discover the basic properties of waves, and analyze data tables and graphs. The...
Curated OER
Historical Population Changes in the US
Students conduct research on historical population changes in the U.S. They conduct Internet research on the Historical Census Data Browser, create a bar graph and data table using a spreadsheet program, and display and interpret their...
Curated OER
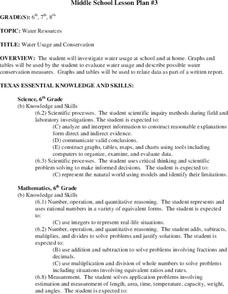
Water Usage and Conservation
Pupils investigate water usage at school and at home. They use graphs and tables to evaluate water usage. Students describe possible water conservation measures. They use graphs and tables to relate data as part of a written report.
Virginia Department of Education
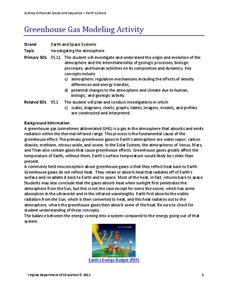
Greenhouse Gas Modeling Activity
Why are greenhouse gases called greenhouse gases? Young Earth scientists learn about greenhouse gases though experimentation in the second installment of a 3-part series. They use lamps to model radiant energy as well as warming through...
Curated OER
Inference Lesson Plan
Students practice assessing graphics to infer and identify an author's implicit and explicit meaning in a piece of text. They evaluate the effectiveness of information found in maps, charts, tables, graphs, diagrams, cutaways and through...
Curated OER
Atlatl Lessons for Grade 4
Fourth graders explore the weapons of the Aboriginal people. In this fourth grade math lesson, 4th graders create charts, tables, or diagrams to represent patterns and relations. Students investigate which dart length has the best...
Curated OER
Let's Plot Points
Use coordinate grid paper to plot points and identify shapes that are already plotted on the paper by saying their coordinates. Pupils also measure the distance between points and play the game Battleship. There are several web links and...
Open Text Book Store
Arithmetic for College Students: Worksheets
Loaded with concepts ranging from multiplying decimals to converting units to solving problems using the order of operations, a thorough practice packet is perfect for a fifth or sixth grade math classroom.
Curated OER
Cindy and Linda - Selling Lemonade
In this pie charts worksheet, learners use the pie chart to count how many glasses of Lemonade were sold by Cindy and Linda. Students complete the table and answer 3 questions.
Other popular searches
- Tables, Charts and Graphs
- Tables Charts and Graphs
- Tables, Graphs, Charts
- Tables, Charts, Graphs
- Maps, Charts, Graphs, Tables
- Graphs Tables Charts
- Charts, Graphs and Tables


