EngageNY
Relationships Between Quantities and Reasoning with Equations and Their Graphs
Graphing all kinds of situations in one and two variables is the focus of this detailed unit of daily lessons, teaching notes, and assessments. Learners start with piece-wise functions and work their way through setting up and solving...
Mathematics Vision Project
Features of Functions
What are some basic features of functions? By looking at functions in graphs, tables, and equations, pupils compare them and find similarities and differences in general features. They use attributes such as intervals of...
Illustrative Mathematics
Transforming the graph of a function
This activity guides learners through an exploration of common transformations of the graph of a function. Given the graph of a function f(x), students generate the graphs of f(x + c), f(x) + c, and cf(x) for specific values of c. The...
West Contra Costa Unified School District
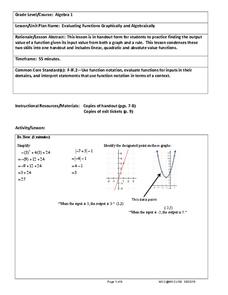
Evaluating Functions Graphically and Algebraically
High schoolers evaluate functions graphically and algebraically. After completing that step, they write a statement describing the input and output.
Texas Instruments
Is It or Isn't It Proportional
How can you tell if number relationships are proportional? Mathematicians investigate proportional relationships. They compare and contrast functions and graphs to determine the characteristics of proportional relationships, as well as...
Charleston School District
Sketching a Piecewise Function
How do you combine linear and nonlinear functions? You piece them together! The lesson begins by analyzing given linear piecewise functions and then introduces nonlinear parts. Then the process is reversed to create graphs from given...
West Contra Costa Unified School District
Comparing Linear and Quadratic Functions
If a linear function and a quadratic function enter a boxing match, which one would win? Learners first review how to find key features of linear and quadratic functions. Next, they compare key features of pairs of functions.
Charleston School District
Graphing Functions
How do letters and numbers create a picture? Scholars learn to create input/output tables to graph functions. They graph both linear and nonlinear functions by creating tables and plotting points.
Saxon
Plotting Functions
Youngsters use a graphing calculator to assist in creating a function table. They graph the function on a coordinate plane. They explore the relationship between the domain and range in the graph. This four-page instructional activity...
Mathed Up!
Straight Line Graphs
Develop graphs by following the pattern. The resource provides opportunities for reviewing graphing linear equations. Pupils create tables to graph linear equations by using patterns whenever possible. The worksheet and video are part of...
EngageNY
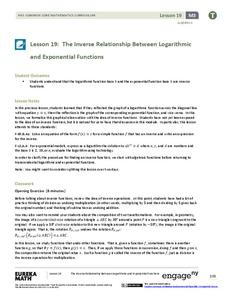
The Inverse Relationship Between Logarithmic and Exponential Functions
Introducing inverse functions! The 20th installment of a 35-part lesson encourages scholars to learn the definition of inverse functions and how to find them. The lesson considers all types of functions, not just exponential and...
EngageNY
Graphing Quadratic Functions from Factored Form
How do you graph a quadratic function efficiently? Explore graphing quadratic functions by writing in intercept form with a lesson that makes a strong connection to the symmetry of the graph and its key features before individuals write...
EngageNY
The Height and Co-Height Functions of a Ferris Wheel
Show learners the power of mathematics as they model real-life designs. Pupils graph a periodic function by comparing the degree of rotation to the height of a ferris wheel.
Curated OER
Graphing and Analyzing
In this graphing and analyzing worksheet, 9th graders first state if each graph represents a linear or nonlinear relationship. Second, they create a difference table for each set of data presented and determine whether it represents a...
Curated OER
Introduction to Functions
Students explore functions, function rules, and data tables. They explore terms of linear functions. Students use computers to analyze the functions. Students write short sentences to explain data tables and simple algebraic expressions.
Curated OER
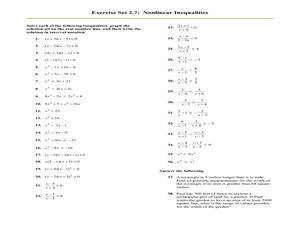
Nonlinear Inequalities
In this Algebra II worksheet, 11th graders solve nonlinear inequalities, graph the solution set on the number line, and write the solution in interval notation. The one page worksheet contains thirty-eight problems. Answers are provided.
Curated OER
Chapter 4 Test: Functions and Integers
In this functions and integers activity, students combine positive and negative integers through addition, subtraction, multiplication and division. They complete function tables and graph the results of linear equations. This six-page...
Illinois State Board of Education
Is It Linear?
Math apprentices are introduced to the components of a linear relationship. In groups, they write story problems that incorporate this relationship and relates to the real world. They give their problem to the class for them to solve.
EngageNY
Representations of a Line
Explore how to graph lines from different pieces of information. Scholars learn to graph linear functions when given an equation, given two points that satisfy the function, and when given the initial value and rate of change. They solve...
Curated OER
Reading Graphs
Working independently or in teams, your class practices connecting graphs, formulas and words. This lesson includes a guided discussion about distance vs. time graphs and looking at how velocity changes over time.
Mathematics Vision Project
Module 4: Linear and Exponential Functions
Sequences and series are traditionally thought of as topics for the pre-calculus or calculus class, when learners are figuring out how to develop limits. But this unit uses patterns and slopes of linear functions in unique ways to bring...
EngageNY
Modeling Linear Relationships
Math modeling is made easy with the first installment of a 16-part module that teaches pupils to model real-world situations as linear relationships. They create graphs, tables of values, and equations given verbal descriptions.
5280 Math
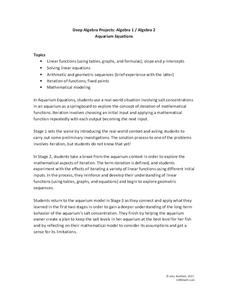
Aquarium Equations
Take a look at linear functions in a new environment. A three-stage algebra project first asks learners to model the salt concentration of an aquarium using linear functions. Then, using iterations, pupils create a set of input-output...
Mathematics Vision Project
Module 1: Functions and Their Inverses
Nothing better than the original! Help your class understand the relationship of an inverse function to its original function. Learners study the connection between the original function and its inverse through algebraic properties,...


