CK-12 Foundation
Ck 12: Algebra: Graphs of Linear Models of Direct Variation
[Free Registration/Login may be required to access all resource tools.] Students will write, graph, and solve direct variation models for real-world problems. Students examine guided notes, review guided practice, study vocabulary, watch...
CK-12 Foundation
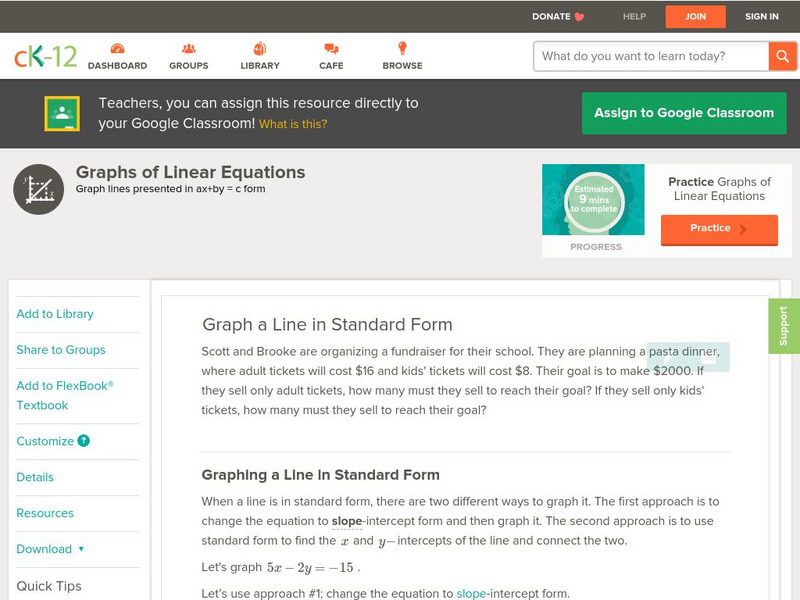
Ck 12: Algebra: Graphs of Linear Equations
[Free Registration/Login may be required to access all resource tools.] Students learn to graph the equation of a line in standard form. Students examine guided notes, review guided practice, watch instructional videos and attempt...
Khan Academy
Khan Academy: Graphs of Nonlinear Piecewise Functions
Given the graph of a nonlinear piecewise function, find its formula.
Varsity Tutors
Varsity Tutors: Hotmath: Graphing Linear Equations
Find a concise explanation of how to graph a linear equation. An example is given and clearly explained.
PBS
Pbs: Comparing Exponential, Quadratic, and Linear Functions
Analyze the numerical and graphical representations of functions. This interactive exercise focuses comparing linear, quadratic, and exponential functions and their graphical representations after completing a table to calculate ordered...
William Mueller
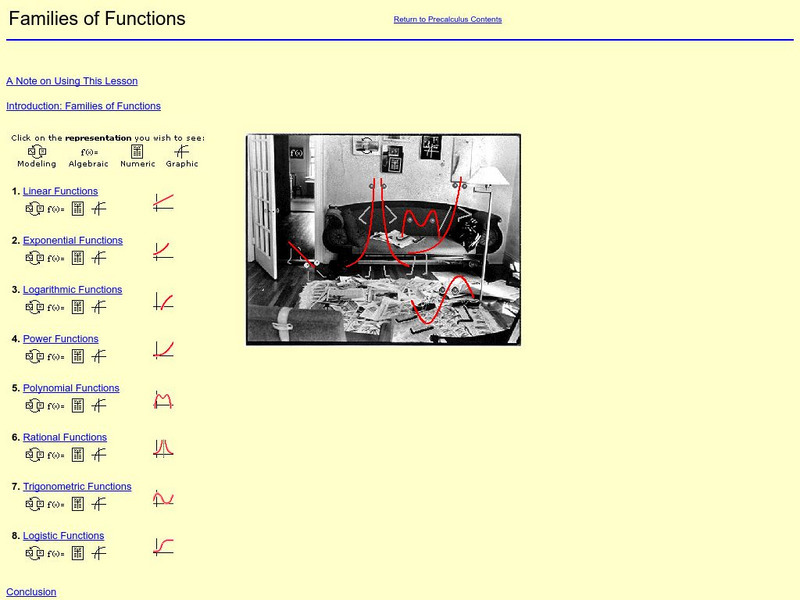
William Mueller: Families of Functions
Meet the Function Family! Each member of the family has examples of their graphs and descriptions of the types of real-world situation that produce those graphs.
McGraw Hill
Glencoe Mathematics: Online Study Tools: Graphing Linear Functions
This site gives a short interactive quiz which allows students to self-assess their understanding of the concept of graphing linear functions.
Illustrative Mathematics
Illustrative Mathematics: F Bf.3 Transforming the Graph of a Function
This task examines, in a graphical setting, the impact of adding a scalar, multiplying by a scalar, and making a linear substitution of variables on the graph of a function f. There is no formula for the function so the focus is on...
Texas Education Agency
Texas Gateway: Determining Slopes From Equations, Graphs, and Tables
Given algebraic, tabular, and graphical representations of linear functions, the student will determine the slope of the relationship from each of the representations.
TeachEngineering
Teach Engineering: Applications of Linear Functions
This lesson plan culminates the unit with the Go Public phase of the legacy cycle. In the associated activities, young scholars use linear models to depict Hooke's law as well as Ohm's law. To conclude the lesson plan, students apply...
Shodor Education Foundation
Shodor Interactivate: Lesson: Graphs and Functions
This lesson plan is directed at introducing learners to how to graph functions on the Cartesian coordinate plane. They will experience several categories of functions including lines and parabolas. Resources and interactive tools are...
Other
Graph pad.com: Comparing Linear Regression to Nonlinear Regression
This resource presents a complete and detailed look at linear regression. This guide provides lots of details and graphs to explain each concept.
Texas Instruments
Texas Instruments: Mc Dougal Littell Middle School Math: Graph Linear Functions
Students will graph the equations and determine if the viewing window is appropriate for the graphs.
Math Planet
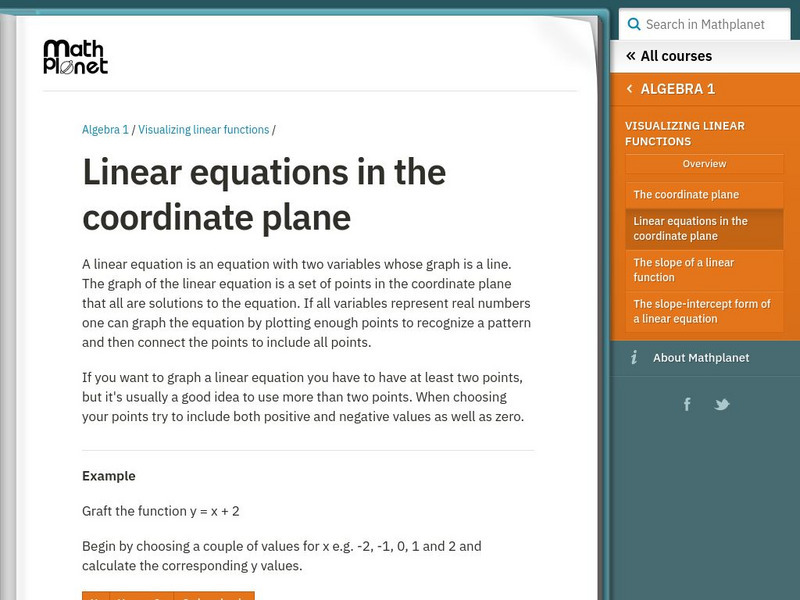
Math Planet: Algebra 1: Linear Equations in the Coordinate Plane
Provides examples and a video lesson that illustrates how to graph a linear equation.
Sophia Learning
Sophia: Graphing Using Intercepts Tutorial
Follow step by step instruction to solve for x and y-intercepts, plot points, and graph the linear function.
Khan Academy
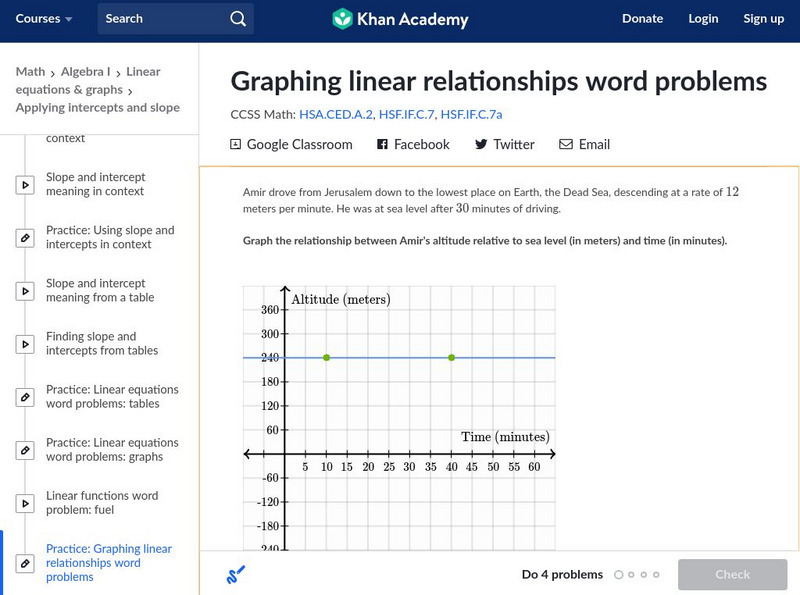
Khan Academy: Graphing Linear Functions Word Problems
Graph the line that represents a real-world relationship that is given verbally. Students receive immediate feedback and have the opportunity to try questions repeatedly, watch a video, or receive hints.


