Curated OER
Linear and Exponential Models
Students investigate the differences between linear and exponential models. In this linear and exponential models lesson, students make a table of given data. Students determine if the data is linear or exponential by plotting the data...
Curated OER
Graphs involving Exponential Functions
In this algebra worksheet, students graph exponential functions and analyze it for growth and decay. There are 9 problems with an answer key.
Curated OER
Products of Linear Functions
Students investigate the horizontal intercepts of functions. In this algebra lesson, students identify whether the factor of two functions results in a quadratic equation or not. They compare and contrast linear equations and higher...
Curated OER
Iterating Linear Functions
Students use a spreadsheet to investigate data. In this algebra instructional activity, students collect and graph data on a coordinate plane. They explain properties of a linear equation both algebraically and orally.
Curated OER
Reflections of a Linear Function
Learners reflect functions about the X-axis, Y-axis, and origin. They derive equations for reflected functions using the website www.explorelearning.com.
Curated OER
Graphing and Interpreting Linear Equations in Two Variables
Graph linear equations using a table of values. Learners solve equations in two variables using standard form of an equation. They identify the relationship between x and y values.
EngageNY
Linear and Exponential Models—Comparing Growth Rates
Does a linear or exponential model fit the data better? Guide your class through an exploration to answer this question. Pupils create an exponential and linear model for a data set and draw conclusions, based on predictions and the...
Curated OER
Real-World Linear Programming
Explore linear programming on a website game. Partners solve a real-world problem by setting up an objective function and a linear inequality. They graph their results on chart paper and also using a calculator before presenting their...
CPM
How to Recognize the Type of Graph from a Table
Linear, quadratic, and exponential functions are represented only by their table of values in this simple, well-written worksheet. Learners decide the type of graph represented based on the differences in the function values. Included is...
Curated OER
Linear Programming
Learners explore inequalities to determine the optimal solution to maximize a profit for a company. In this linear programming lesson, students discover how to graph inequalities and how to determine the algebraic representation of a...
Inside Mathematics
Graphs (2006)
When told to describe a line, do your pupils list its color, length, and which side is high or low? Use a worksheet that engages scholars to properly label line graphs. It then requests two applied reasoning answers.
Charleston School District
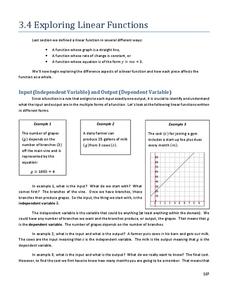
Exploring Linear Functions
What does a graph or equation say about a situation? Lots! The lesson uses the concepts explored in the previous four lessons in the series and applies them to problem solving situations. Learners create an equation from problems posed...
Charleston School District
Pre-Test Unit 4: Linear Funcitons
Let your classes show you what they know! Use this pre-test to assess the current knowledge of your learners. The assessment includes all pre-algebra concepts related to functions: writing and graphing linear relationships, comparing...
Intel
Choreographing Math
Leaners investigate families of linear functions through dance. They choreograph dance moves to model nine unique linear functions of their choosing. Using their dance moves, teams create a video presentation complete with music and...
Curated OER
Linear Inequalities
Through exploration of linear programming through graphs and equations of inequalities, students relate linear programming to real life scenarios, such as business. Graphing and shading is also part of this exercise.
Curated OER
Linear Programming
In this linear programming worksheet, students solve and complete 6 different word problems related to programming. First, they define the variables in each problem and write a system of inequalities. Then, students graph the...
CCSS Math Activities
Smarter Balanced Sample Items: High School Math – Target M
Your knowledge of graphs is a function of how much you try. Young mathematicians work on a set of 12 questions that covers graphing functions, comparing functions, and rewriting functions in different forms to determine key features....
Curated OER
Explore Learning Exponential Functions
High schoolers graph exponential equations and solve application problems using exponential functions. They re-enact a story about a peasant worker whose payment for services is rice grains doubled on a checker board. They place M &...
Curated OER
Linear Regression and Correlation
Learners explore scatter plots. For this linear regression lesson, groups of pupils graph scatter plots and then find the line of best fit. They identify outliers and explain the correlation. Each group summarizes and shares their...
West Contra Costa Unified School District
Introduction to Inverse Functions
Ready to share the beauty of the inverse function with your classes? This algebra II instructional activity guides the discovery of an inverse function through a numerical, graphical, and an algebraic approach. Connections are made...
Mathematics Assessment Project
Printing Tickets
That's the ticket! Pupils write and investigate two linear functions representing the cost of printing tickets. Individuals then determine which of two printing companies would be a better buy.
Curated OER
Exponential Functions
Learners graph exponential equations of the form y=Ma. They understand the effects of M, a, and k on the graph. They solve application problems using exponential functions.
CCSS Math Activities
Out of the Swimming Pool
Out of the swimming pool and into the math classroom! Young mathematicians analyze two linear functions representing the number of liters of water in a pool as it drains over time. They must evaluate functions, interpret function...
CK-12 Foundation
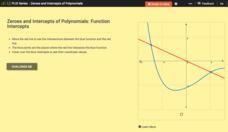
Zeroes and Intercepts of Polynomials: Function Intercepts
There is zero reason not to use the resource. Given a graph with a polynomial function and a linear function, scholars move the line in an interactive. To wrap up the lesson, they note how zeros and intersection points change.


